
Battery Cycle Life
Quick Answer
Cycle life is the number of full charge and discharge cycles a battery can complete before its usable capacity falls to a defined threshold, almost always 80% of its original rated capacity. A LiFePO4 cell rated for 3,000 cycles is not guaranteed to fail at cycle 3,001. It means that, under the manufacturer’s test conditions, capacity has dropped to 80% by that point, and it keeps fading beyond it.
The rated number only holds under the conditions it was tested at: full depth of discharge, a moderate discharge rate, and 25°C. Real installations rarely match all three. Shallower discharges extend cycle count. Faster discharge and higher operating temperature shorten it, sometimes by more than half. A battery rated for 3,000 cycles can realistically deliver anywhere from 2,000 to well over 6,000 depending on how it is actually used.
What Cycle Life Actually Measures
A cycle is one complete charge-discharge event, not one plug-in event, and it is measured in amp-hours or watt-hours moved through the cell rather than in elapsed time. For background on the underlying units, see the Sielectronix guide to Wh vs Ah. International Electrotechnical Commission standard IEC 61960-3 governs performance testing for secondary lithium cells used in portable applications, including how a test cycle is defined and how capacity is measured between cycles. Industry practice, reflected in standards such as API RP 14F, defines end of life as the point where a recharged battery retains only 80% of its original ampere-hour capacity.
That 80% figure is a convention, not a hard physical cliff. A battery does not stop working the moment it crosses that line. It keeps running, delivering progressively less usable energy per charge, with an accelerating fade rate past that point in most lithium chemistries. Manufacturers chose 80% because it is roughly where most applications start to feel the shortfall in runtime, not because the chemistry fails there.
Cycles also do not have to be full. If a portable power station is drawn down from 100% to 60% and recharged, that is 0.4 of a cycle, not one. A battery management system (BMS) that tracks cycle count usually accumulates these partial discharges: two 50% discharges add up to one equivalent full cycle. This is why light, shallow use extends real-world service life well beyond what a naive “one plug-in, one cycle” count would suggest.
Cycle Life Is Not Calendar Life
These are two separate aging clocks running at the same time, and confusing them leads to bad sizing decisions.
Cycle life is wear from use: every charge-discharge cycle stresses the electrode structure and electrolyte, and that stress accumulates with cycle count, discharge depth, and rate.
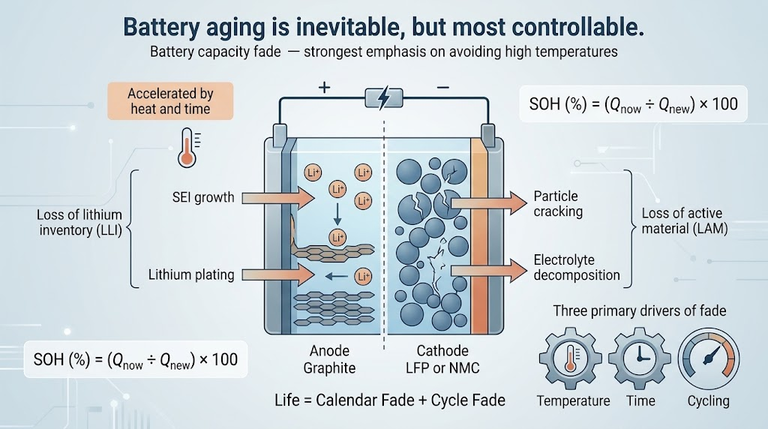
Calendar life is wear from time, independent of use. A battery sitting in a closet at high state of charge and warm ambient temperature degrades even if it is never cycled. Electrolyte breakdown and solid electrolyte interphase (SEI) growth continue in the background. A peer-reviewed comparative review of energy storage chemistries puts typical calendar life for lithium batteries at 5 to 10 years, separate from whatever cycle count the same cell might otherwise achieve.
A rarely used backup power station can hit its calendar-life limit before it ever approaches its rated cycle count. A daily-use unit is more likely to hit the cycle limit first. Whichever ceiling comes first determines actual service life, and a spec sheet quoting only cycles is giving half the picture.
What Determines Cycle Life
Four variables move the number materially: depth of discharge, discharge rate, temperature, and charge voltage limits.
Depth of Discharge
This is the single largest lever. Cycling a cell through a shallow discharge window degrades it far less per cycle than a full discharge, so the total number of cycles before reaching the 80% threshold rises sharply as depth of discharge falls.
Peer-reviewed testing on lithium iron phosphate EV cells found a cell rated for 3,221 cycles at 80% depth of discharge could complete 34,957 shallow cycles at 20% depth of discharge before hitting the same 80% capacity threshold, roughly a tenfold increase from a fourfold reduction in discharge depth. The relationship is not linear. Diminishing depth of discharge produces disproportionately larger cycle-count gains, which is the underlying reason battery management systems on quality LiFePO4 packs reserve a buffer at both ends of the state-of-charge range rather than allowing true 0 to 100% swings.
The Sielectronix guide to depth of discharge covers how DoD interacts with usable capacity in more detail; this article focuses specifically on its effect on cycle count.
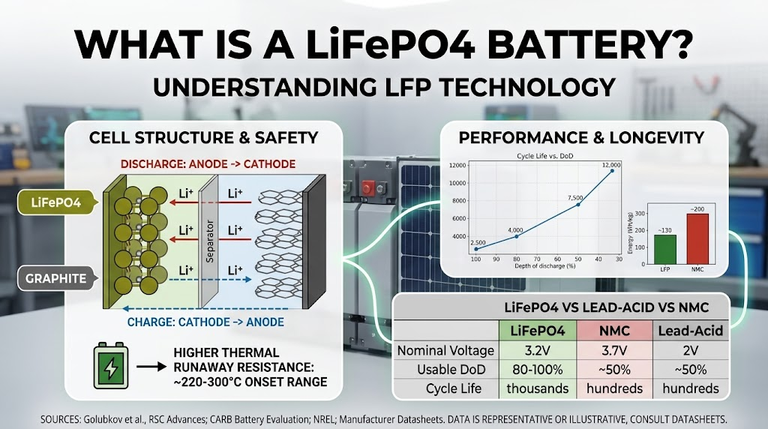
Manufacturer datasheets and published aging studies converge on a broadly consistent shape for consumer LiFePO4 cells, summarized below. These are typical figures, not measurements from a specific product, and individual cells vary by manufacturer and test protocol.
| Depth of Discharge | Typical Cycle Life to 80% Capacity |
| 100% | ~2,000 cycles |
| 80% | ~3,000 cycles |
| 50% | ~5,000 cycles |
| 30% | ~7,000+ cycles |
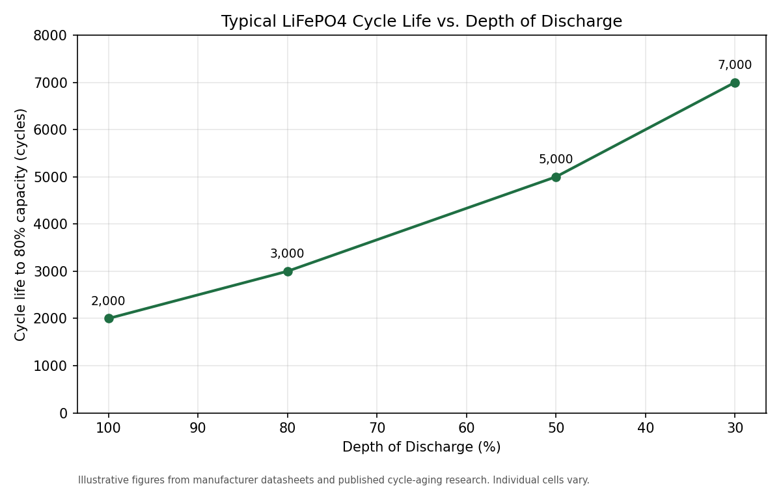
Figure: Typical LiFePO4 cycle life vs. depth of discharge, based on manufacturer datasheets and published aging research.
Discharge Rate (C-Rate)
Higher discharge current accelerates degradation independent of how deep the discharge goes. A peer-reviewed accelerated life study on prismatic LiFePO4 cells found that increasing discharge rate from 0.5C to 0.8C at a constant 25°C reduced projected cycle life by 52.9%, close to cutting it in half from a discharge rate increase most users would consider modest.
This matters directly for portable power stations running high-draw loads like microwaves, space heaters, or power tools near the unit’s rated continuous output. Consider a 500Wh station built around a 100Ah, 5.12V-equivalent LiFePO4 pack (simplified for illustration). Running a 300W load draws roughly 60A, close to 0.6C. Running a 1,000W microwave draws roughly 195A, close to 2C. Both loads are within the unit’s rated output, and both will run the appliance successfully, but the aging cost per cycle is not the same: the higher discharge rate accelerates the degradation mechanisms described
bove, meaning heavy, high-wattage loads wear the pack down faster per equivalent cycle than light ones, even before accounting for the additional depth-of-discharge effect if the heavier load also runs the battery down further. The Sielectronix guide to C-rate explains how to calculate this figure for a specific load and battery pack.
Temperature
Elevated operating temperature accelerates the chemical side reactions responsible for capacity fade. The same accelerated-aging study found that raising ambient temperature at a constant discharge rate reduced predicted cycle life by 23.2% to 41.36% depending on the specific temperature step tested. Separate modeling work from the U.S. Department of Energy’s National Renewable Energy Laboratory confirms temperature as one of the primary inputs in lithium-ion capacity fade models, alongside state of charge, depth of discharge, and cycle count, in its battery degradation modeling research.
A commonly cited engineering rule of thumb holds that cycle life roughly halves for every 10°C sustained rise above a cell’s rated test temperature (typically 25°C). Treat this as an approximation useful for directional planning, not a precise conversion factor, since the actual relationship varies by cell chemistry and formulation.
This is a genuine constraint for installations across most of Nigeria, where ambient temperatures regularly exceed 30°C and enclosed inverter cabinets or direct sun exposure push cell temperature well above that. A portable power station or battery bank stored in a hot equipment room or left in direct sun during the day is accumulating degradation faster than the same unit kept in a shaded, ventilated space, even if the two see identical charge and discharge patterns.
Charge Voltage and State of Charge
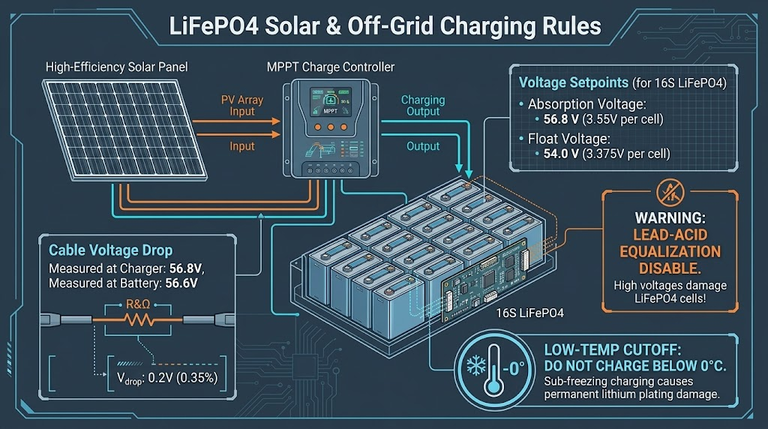
Holding a lithium cell at a high state of charge for extended periods accelerates calendar aging, and charging to the absolute top of the voltage window on every cycle adds cumulative stress beyond what a partial charge does. This is why some manufacturers offer a “storage mode” or reduced charge limit setting, and why leaving a portable power station permanently plugged in at 100% is a slower but real drain on service life even without active cycling.
How a BMS Actually Counts Cycles
Most portable power stations and quality LiFePO4 packs expose a cycle count through the companion app or an onboard display, and understanding how that number is generated avoids two common misreadings.
The BMS does not count plug-in events. It tracks cumulative amp-hours discharged and divides by the battery’s rated capacity. Discharge 50Ah from a 100Ah-rated pack, and the counter advances by 0.5 cycles regardless of whether that 50Ah came out in one session or ten small ones spread across a week. This is why two owners with identical units and identical calendar age can show very different cycle counts: one runs the unit down hard for evening backup every night, the other tops off a laptop occasionally, and the cumulative amp-hour throughput between them can differ by an order of magnitude.
This also means the displayed cycle count is a genuinely useful proxy for remaining cycle life, more useful than elapsed calendar time alone. A unit showing 400 cycles against a 3,000-cycle rating has consumed roughly 13% of its rated cycle budget, independent of how many months or years that took to accumulate. Checking this figure periodically, where the manufacturer exposes it, is a more accurate way to gauge remaining service life than estimating from age or from a rough sense of how often the unit gets used.
What Happens Past the 80% Threshold
The 80% capacity mark is a convention, not a cliff, but the fade rate is not constant across a cell’s life. Lithium-ion and LiFePO4 cells typically show a period of roughly linear, gradual capacity loss followed by an inflection point, sometimes called a knee, after which fade accelerates noticeably. A research synthesis on this behavior, published on the physics preprint archive arXiv and covering multiple lithium chemistries and studies, documents this nonlinear aging pattern and notes that the transition point varies by cell design, operating history, and stress conditions rather than occurring at a fixed cycle number.
For a practical reading of this: a cell that has degraded gradually and predictably from 100% to 80% capacity over its rated cycle life should not be assumed to fade at the same gentle rate for the next equivalent stretch.
Continued use past the 80% mark remains functionally safe under normal charge and discharge conditions for a properly designed BMS-protected pack, but expect the rate of capacity loss to increase, and expect internal resistance to rise, which shows up as a battery that sags more under load and recovers voltage more slowly than it did when new. This is a reasonable point to start planning for replacement in load-critical applications, even though the unit will likely continue to function for some additional period.
Converting Rated Cycles Into Real Years
A cycle rating only becomes useful once converted into an expected service period for the way the unit will actually be used.
The calculation:
Expected years = Rated cycle life ÷ Cycles per year
Cycles per year depends on usage pattern, not calendar days. A unit cycled once daily accumulates approximately 365 cycles per year. A unit used only during periodic outages, say three full cycles a week, accumulates roughly 156 cycles per year.
Worked example 1: Daily-use router backup
A small LiFePO4 unit rated for 2,000 cycles, cycled fully once per day:
2,000 cycles ÷ 365 cycles/year ≈ 5.5 years
Worked example 2: EcoFlow Delta 2, published manufacturer figures
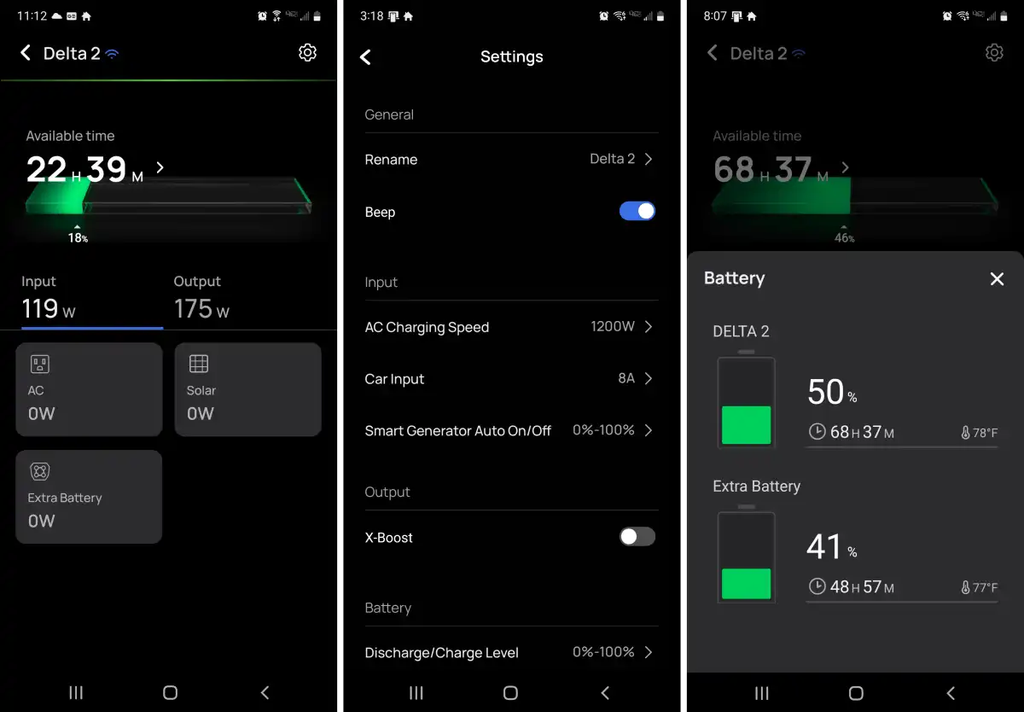
EcoFlow rates the Delta 2 at 3,000 charge-discharge cycles to 80% capacity, with an approximate 10-year expected service life. At full daily cycling, 3,000 cycles ÷ 365 ≈ 8.2 years, short of the manufacturer’s 10-year figure. The gap is explained by real-world usage: most owners are not fully discharging and fully recharging every single day, and the manufacturer’s 10-year estimate assumes a more typical mixed usage pattern with a meaningful share of partial cycles.
Worked example 3: Occasional emergency backup
A 3,000-cycle unit used only during outages, averaging one full-equivalent cycle every ten days (36.5 cycles/year):
3,000 ÷ 36.5 ≈ 82 years
In practice, calendar life caps this scenario long before cycle life would. A cell with a 5 to 10 year calendar life will reach end of life from time-based degradation decades before 82 years of cycling wears it out. This is the clearest illustration of why the two aging clocks matter independently: for a lightly used backup unit, calendar life is almost always the binding constraint, not the cycle rating printed on the box.
Chemistry Comparison
Cycle life varies substantially by chemistry, and it is one of the clearest technical arguments for LiFePO4 in stationary and portable applications over older lithium-ion chemistries and lead-acid.
| Chemistry | Typical Cycle Life to 80% | Typical Calendar Life |
| LiFePO4 (LFP) | 2,000-6,000+ cycles | 8-15 years |
| NMC / NCA Lithium-Ion | 500-1,500 cycles | 5-10 years |
| Lead-Acid (flooded/AGM) | 300-500 cycles | 3-5 years |
LiFePO4’s cycle-life advantage comes from a more chemically and thermally stable cathode structure that resists the degradation mechanisms (transition metal dissolution, structural collapse) that shorten NMC and NCA cycle life. Lead-acid’s shorter cycle life stems from a fundamentally different failure mode: sulfation, the gradual formation of hard lead sulfate crystals on the plates that becomes progressively harder to reverse on recharge, combined with active material shedding from the plates with each discharge cycle.
This is also why lead-acid systems are conventionally sized around 50% usable depth of discharge while LiFePO4 systems can be sized around 80 to 100% usable depth: pushing lead-acid deeper collapses its already short cycle life far faster than the equivalent discharge does to a LiFePO4 cell.
How Portable Power Station Manufacturers Actually Rate This
Published cycle-life figures for current portable power stations give a useful real-world anchor for what these numbers look like on finished consumer products rather than bare cells:
- Jackery rates the Explorer 300 Plus at 3,000 cycles to 80%+ capacity, describing its LiFePO4 pack as roughly six times the cycle life of standard lithium-ion.
- EcoFlow rates the Delta 2 at 3,000 cycles to 80% capacity, with an approximate 10-year expected service life at typical usage.
- Bluetti rates its Apex 300 and Elite 300 V2 models at 6,000 cycles to 80% capacity, above the 3,000 to 4,000 cycle range the company describes as the current industry average for comparable units.
The spread between a 2,000-cycle entry-level unit and a 6,000-cycle premium unit is real and reflects genuine differences in cell quality, BMS sophistication, and thermal management, not just marketing language. Whether that difference justifies the price gap depends entirely on projected usage pattern. A unit cycled a handful of times a year will not meaningfully benefit from a 6,000-cycle rating over a 3,000-cycle one; a unit running daily loads as a genuine off-grid power source will. The Sielectronix guide to sizing a portable power station covers how projected daily use should factor into that purchase decision alongside cycle life.
Common Mistakes
Treating the rated cycle number as a hard failure point.
Reaching the rated cycle count means the battery has faded to 80% capacity, not that it has stopped functioning. It continues to operate, with declining runtime, until it becomes impractical for the intended load.
Ignoring depth of discharge when comparing two products.
A 2,000-cycle rating tested at 100% DoD and a 3,000-cycle rating tested at 80% DoD are not directly comparable line items. Check the DoD the cycle figure was tested at before treating it as an apples-to-apples spec.
Assuming manufacturer cycle life applies regardless of climate.
A cycle rating generated at 25°C in a controlled lab does not automatically transfer to a unit operating in a hot equipment room or direct sun. Expect measurably shorter real-world cycle life in consistently high-temperature environments.
Confusing partial cycles with full cycles when estimating remaining life.
Ten 10% discharges are one equivalent full cycle, not ten. Sizing a replacement schedule around raw plug-in events rather than equivalent full cycles overestimates wear substantially for light users and underestimates it for anyone running the unit near its rated output regularly.
Forgetting calendar life exists.
A battery rarely cycled can still fail from age-related degradation well before its cycle count becomes relevant, particularly if it spends long periods at high state of charge in a warm environment.
Extending Real-World Cycle Life
Practical steps that measurably slow cycle-related degradation, drawn from the variables above:
- Avoid habitually discharging to the absolute minimum state of charge when the application does not require it. A shallower typical discharge window extends cycle count disproportionately.
- Keep the unit in a shaded, ventilated location rather than direct sun or an enclosed hot space, particularly relevant in high-ambient-temperature climates.
- Avoid running loads that push sustained output close to the unit’s rated maximum when a lower-draw alternative exists, since higher discharge current accelerates fade independent of DoD.
- Where the manufacturer offers a reduced charge limit or storage mode for units left idle for extended periods, use it rather than leaving the unit permanently topped off at 100%.
These practices are covered in more operational detail in the Sielectronix guide to portable power station maintenance.
Frequently Asked Questions
Does a battery stop working once it reaches its rated cycle count?
No. The rated cycle count marks the point where capacity has typically faded to 80% of original, not a failure point. The unit keeps operating with reduced runtime, and degradation continues past that threshold at an accelerating rate in most lithium chemistries.
Is a higher cycle-life rating always worth paying more for?
Only if projected usage will actually accumulate meaningful cycles. A backup unit used a handful of times a year is far more likely to be limited by calendar life than cycle life, in which case a premium cycle-life rating delivers little practical benefit.
Does partial charging count as a full cycle?
No. Cycle counting is cumulative by depth of discharge. Two 50% discharges equal one full-equivalent cycle, which is why frequent shallow use extends real-world service life well beyond a naive count of plug-in events.
Why do LiFePO4 batteries have a longer cycle life than standard lithium-ion?
LiFePO4’s cathode structure is more chemically and thermally stable than NMC or NCA cathodes, resisting the transition-metal dissolution and structural degradation mechanisms that shorten cycle life in those chemistries. This stability is also why LiFePO4 tolerates deeper routine discharge without the same cycle-life penalty.
Can I check my own unit’s actual cycle count?
On units where the manufacturer exposes it, usually through a companion app or onboard display, yes. The figure is calculated from cumulative amp-hours discharged divided by rated capacity, not from the number of times the unit has been plugged in, and comparing that number against the rated cycle life gives a more accurate read on remaining service life than estimating from age alone.
The Bottom Line
Cycle life is a useful comparison figure, but only when read alongside the conditions it was tested under. A 3,000-cycle rating tested at 80% depth of discharge and 25°C tells a materially different story than the same number reached at 100% depth of discharge in a hot equipment room, and the DoD, discharge rate, and operating temperature of the actual installation matter as much as the number printed on the spec sheet.
For sizing decisions, run the conversion into expected years using the projected usage pattern rather than comparing raw cycle numbers between products, and check whether calendar life or cycle life will realistically be the binding constraint for that specific application before paying a premium for a higher cycle rating.
[…] record implies for Nigerian conditions. For the cycle-count view of the same subject, see battery cycle life explained; for a power-station-specific look at wear, see portable power station battery […]