Lithium-Ion Battery Charging Explained
Battery Technology > Battery Charging | Technical explainer | Reviewed September 29, 2026
A lithium-ion charger does not push a fixed quantity of energy into a battery. It controls current first, then voltage, and the cell decides how much charge it accepts along the way. The limits that govern that sequence come from the cell chemistry, not from the charger’s connector or its wattage label.
Quick answer Method:
constant current, constant voltage (CC-CV). Current is held fixed until the cell reaches its voltage ceiling, then voltage is held fixed while current decays. In the model below the decay phase delivers 14 to 38 percent of the charge, depending on where CC ends. Voltage ceiling per cell: 4.20 V for conventional NMC, NCA and LCO cells, with a tolerance of about plus or minus 50 mV, per Battery University BU-409. LiFePO4 cells use 3.65 V per cell in the EVE LF280K cell specification, matching BU-405. Some retail guides quote 3.6 V. End of charge: current falls to roughly 3 to 5 percent of the Ah rating.
The Panasonic NCR18650B datasheet cuts off at 65 mA on a 3.25 Ah cell, which is 2 percent. Time estimate: t = f x Q / I_cc + tau x ln(I_cc / I_term), with tau = (1 – f) x Q / I_cc. For a 0.5C cell the model below gives 2.7 to 3.8 hours, against a manufacturer figure of 4.0 hours. Raising the cutoff from 0.02C to 0.10C saves about an hour and leaves the cell about 5 percent short. Temperature: consumer lithium-ion cells should not be charged below 0 C. Sub-freezing charging plates metallic lithium on the anode and the damage is permanent. Solar and off-grid: the charge controller needs a lithium profile with lithium-specific setpoints. Lead-acid equalization voltages exceed the LiFePO4 cell ceiling.
What a Charger Does Inside the Cell
Charging moves lithium ions from the cathode, through the electrolyte and separator, into the graphite anode. Electrons take the external route, pushed by the charger. Discharge reverses both paths. The electrolyte passes ions but blocks electrons, so the electrons have no shortcut and every coulomb of ion transfer is matched by a coulomb through the external circuit.
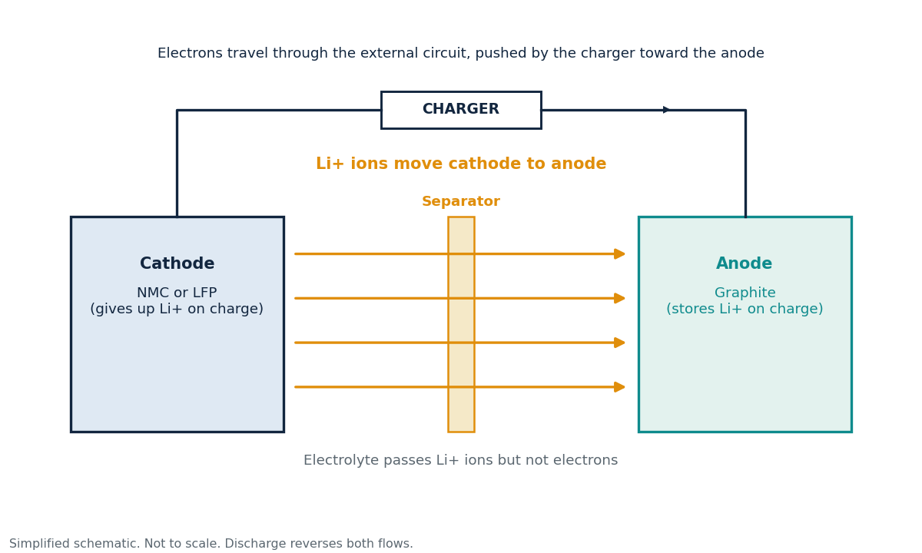
Figure 1. Ion and electron flow during charging. Simplified schematic, not to scale.
Two consequences follow. First, charge acceptance is limited by how fast ions can enter graphite, not by how much power the charger can supply. Second, charge efficiency is high. Battery University puts charge efficiency at about 99 percent for an energy cell, with a temperature rise of around 5 C when the pack reaches full charge. Energy efficiency is lower than charge efficiency because current through internal resistance dissipates as heat (P = I squared x R), so faster charging wastes more.
This is why capacity in ampere-hours describes charge, while stored energy needs voltage as well. The Wh vs Ah guide covers that conversion, and the watt-hour capacity calculation shows it for real packs.
The CC-CV Algorithm, Stage by Stage
Almost every lithium-ion charger, from a phone IC to an off-grid inverter-charger, runs the same two-phase profile. LG Energy Solution describes CC-CV as the dominant method and notes it is written into battery safety guidelines.
Stage 0: pre-charge for deeply discharged cells
Charger ICs apply a small conditioning current to a cell below a low-voltage threshold before allowing full current. The Texas Instruments bq2407x datasheet describes three phases: conditioning, constant current and constant voltage. It runs a pre-charge timer and flags a fault if the cell has not crossed the low-voltage threshold when the timer expires. The threshold and current are set per chip, so no single value applies. The purpose is to avoid forcing high current into a cell whose internal state is uncertain. A pack whose BMS has disconnected it for under-voltage may need a charger that can wake it, and a generic bench supply is not a safe substitute.
Stage 1: constant current (CC)
The charger holds current at a fixed value, usually chosen as a C-rate. Terminal voltage rises as the cell fills. The terminal voltage is not the open-circuit voltage: it equals the open-circuit voltage plus the drop across internal resistance, V_terminal = V_OCV + I x R. When the terminal voltage reaches the ceiling, the cell is not full. A patent-literature description of the same behavior notes that internal resistance means the cell is not fully charged at the end of the CC mode. For a typical energy cell, Battery University reports roughly 85 percent state of charge at the end of this stage.
Stage 2: constant voltage (CV)
The charger now clamps voltage at the ceiling and lets current fall. As ions fill the remaining sites in the graphite, the driving overpotential shrinks and current tapers off exponentially. This is a saturation phase. It adds the last portion of capacity, and Battery University quantifies the trade: full saturation adds about 10 percent capacity but holds the cell at high voltage, which adds stress.
Stage 3: termination, with no float
Charging ends when current drops below a threshold. Published thresholds differ: 3 to 5 percent of the Ah rating, about 3 percent, and 2 percent in the Panasonic datasheet. All are defensible. A higher threshold shortens charge time and leaves the cell slightly less full. Lead-acid batteries take a float charge; Battery University states that maintaining lithium-based batteries on a float charge would shorten life span and can compromise safety on some systems. Manufacturer practice for LiFePO4 is not uniform, and that is covered in the solar section below.
Termination is also a safety function. The TI charger datasheet programs the termination current with an external resistor, starts a fast-charge timer, and flags a fault if current has not fallen to the termination level before the timer expires. It also documents a mode where termination is disabled and the device simply stays in constant voltage. That mode is legitimate for a system with its own termination logic. On a bare cell it means indefinite dwell at the voltage ceiling, which BU-405 says a cell should never do for more than a few hours.
| Stage | Controlled variable | What changes | Exit condition |
| Pre-charge | Small fixed current | Voltage rises from a low starting point | Voltage passes a chip-specific threshold |
| CC | Current (fixed) | Voltage climbs; power rises with voltage | Terminal voltage reaches the ceiling (4.20 V or 3.65 V per cell) |
| CV | Voltage (fixed) | Current decays roughly exponentially | Current falls to the termination threshold |
| Termination | Charge current off | Voltage relaxes toward open-circuit value | Charger restarts only if voltage sags to a recharge threshold |
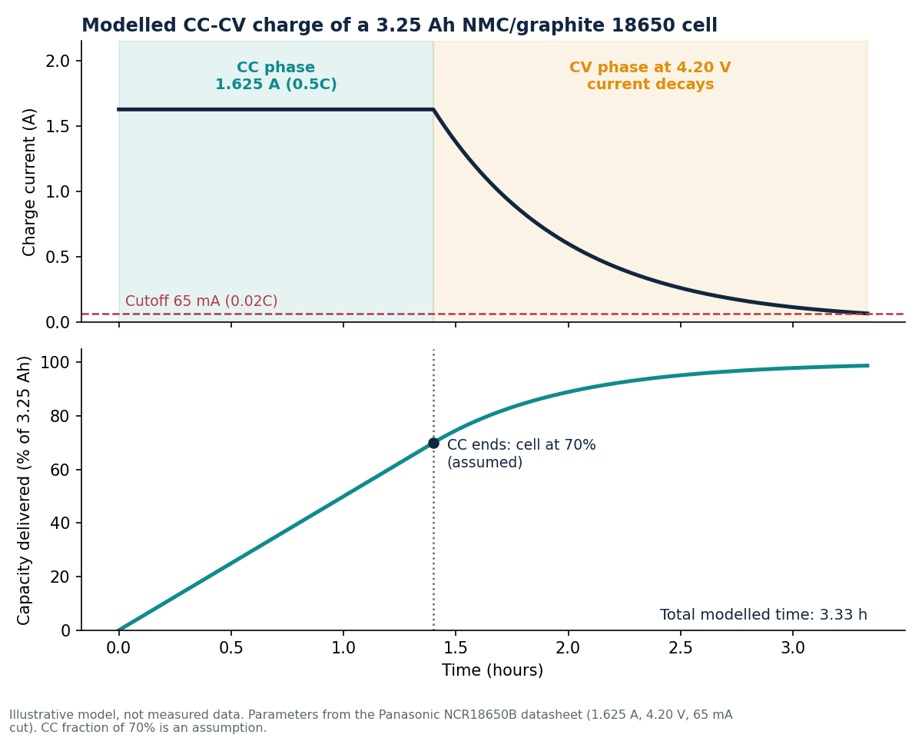
Figure 2. Modelled CC-CV charge of a 3.25 Ah cell using NCR18650B datasheet parameters.
Voltage Limits by Chemistry and Pack Size
The voltage ceiling is a property of the cathode, anode and electrolyte together. Raising it buys capacity and costs cycle life and safety margin. Battery University BU-808 reports that at 4.35 V per cell the cycle count of a regular lithium-ion cell is cut in half. Protection circuits exist to stop a pack from exceeding its set voltage, and their limits are not adjustable by the user.
| Chemistry | Nominal V/cell | Charge ceiling V/cell | Notes |
| NMC, NCA, LCO (conventional) | about 3.6 | 4.20 (plus or minus 0.05) | Some nickel-based variants use 4.10 V; high-capacity cells may use 4.30 V or more, per BU-409. |
| LiFePO4 | about 3.2 to 3.3 | 3.65 | Ceiling per the EVE LF280K specification and BU-405. Nominal voltage per BU-409b and the datasheet. Some retail guides quote 3.6 V. |
| Lithium titanate (LTO) | not covered here | 2.85 | Ceiling per BU-405. |
Pack ceiling follows from series count:
V_pack,max = N_series x V_cell,max
| Pack | Series cells | Maximum charge voltage | Comment |
| 3S NMC | 3 | 3 x 4.20 = 12.6 V | Common 12 V class NMC pack |
| 4S LiFePO4 | 4 | 4 x 3.65 = 14.6 V | Nominal 12.8 V. Victron’s default absorption is 14.2 V (3.55 V/cell) |
| 13S NMC | 13 | 13 x 4.20 = 54.6 V | Common e-bike class pack |
| 16S LiFePO4 | 16 | 16 x 3.65 = 58.4 V | Nominal 51.2 V. Victron’s default absorption is 56.8 V (3.55 V/cell) |
Charging a 4S LiFePO4 pack from a source set for a different cell count or chemistry is the most common way a correct charger becomes an incorrect one. The connector fits, the voltage does not.
Charge Rate and C-Rate
C-rate expresses current relative to capacity: I = C-rate x Ah. A 100 Ah battery charged at 0.5C receives 50 A. A 3.25 Ah cell at 0.5C receives 1.625 A, which is exactly the Panasonic standard charge current.
Battery University gives the advised charge rate for an energy cell as 0.5C to 1C, with complete charge in about 2 to 3 hours, and notes that manufacturers recommend 0.8C or less to prolong life. The same source advises stopping use of the charger or battery if temperature rises more than 10 C at moderate charging speeds. Faster charging is possible, but it is a cell design question. Fast-charging behaviour depends on graphite kinetics, electrolyte and cell temperature, and a 2025 perspective identifies lithium plating on graphite as the core limiter.
Charge rate also has a practical ceiling from the charger side. A source that supplies P watts into a pack at voltage V can deliver at most I = P / V, so a low-voltage pack at high power needs high current and thicker conductors. Cable loss scales with I squared x R, so doubling current through the same cable roughly quadruples its heat.
Lithium Charge Time and Charger Sizing Calculator
Estimates CC-CV charge time, capacity at cutoff, maximum charge voltage and the charger rating a battery needs. Planning estimate, not a measurement.
Model: t_CC = (f - s0) x Q / I_cc; tau = (1 - f) x Q / I_cc; t_CV = tau x ln(I_cc / I_term); capacity at cutoff = Q x [f + (1 - f)(1 - I_term / I_cc)]. Charger DC power = I_cc x charger voltage, where charger voltage = cells in series x volts per cell. Assumes constant temperature, exponential CV decay, unity power factor and a steady mains supply. Real charge time depends on cell resistance, temperature, ageing and the charger's own limits. Follow the battery maker's datasheet for all limits. Charging below 0 C damages lithium cells.
Worked Example 1: Charge Time of a Single Cell
Charge time in CC is easy. Charge time in CV is not, because current decays and the cutoff decides where the process stops. A first-order model treats CV current as an exponential decay from I_cc toward zero with time constant tau. The cell is only asymptotically full, and the charger stops when current reaches I_term.
t_CC = f x Q / I_cc
tau = (1 – f) x Q / I_cc
t_CV = tau x ln(I_cc / I_term)
Capacity at cutoff = Q x [ f + (1 – f) x (1 – I_term / I_cc) ]
Where f is the fraction of capacity delivered during CC, Q is capacity in Ah, I_cc is the CC current in A, I_term is the termination current in A, and tau is in hours. The CV expression comes from I = I_cc x e^(-t/tau). Charge delivered in CV up to time t is I_cc x tau x (1 – e^(-t/tau)), and tau is chosen so that the asymptote equals the remaining (1 – f) x Q.
Inputs from the Panasonic NCR18650B datasheet: nominal capacity 3.25 Ah (minimum), I_cc = 1.625 A, ceiling 4.20 V, I_term = 0.065 A. The value of f is not in the datasheet. It depends on cell resistance, rate and temperature, so three values are used: 0.60, 0.70 and 0.85. One retail guide quotes 60 to 80 percent for the CC stage, and Battery University gives about 85 percent for a typical charge-and-run charger.
Calculation for f = 0.70:
t_CC = 0.70 x 3.25 / 1.625 = 1.40 h
tau = 0.30 x 3.25 / 1.625 = 0.600 h
t_CV = 0.600 x ln(1.625 / 0.065) = 0.600 x ln(25) = 0.600 x 3.219 = 1.93 h
t_total = 1.40 + 1.93 = 3.33 h
Capacity at cutoff = 3.25 x [0.70 + 0.30 x (1 – 0.04)] = 3.25 x 0.988 = 3.21 Ah
| CC fraction f | t_CC (h) | tau (h) | t_CV (h) | Total (h) | Capacity at cutoff |
| 0.60 | 1.20 | 0.800 | 2.58 | 3.78 | 98.4% |
| 0.70 | 1.40 | 0.600 | 1.93 | 3.33 | 98.8% |
| 0.85 | 1.70 | 0.300 | 0.97 | 2.67 | 99.4% |
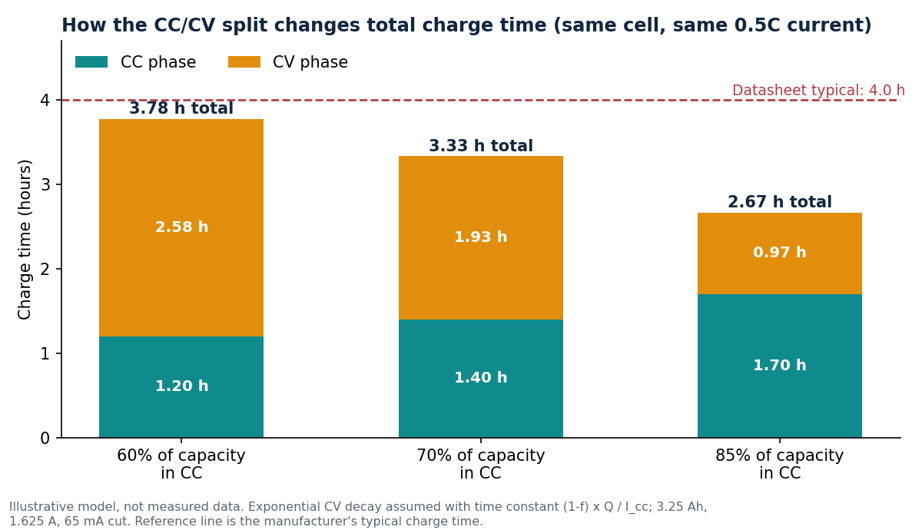
Figure 3. Charge time for the same cell and current, split into CC and CV phases for three assumed CC fractions.
Interpretation. In the first two cases the CV phase is more than half the total time while delivering only 29 to 38 percent of the charge. That is the mechanism behind the familiar observation that the last part of a charge is slow. The datasheet's 4.0 hour typical figure sits above all three results. The datasheet does not state its basis, so reading it as a conservative rating with margin is an inference and not a documented fact.
The termination current is a design choice
Published cutoffs range from 2 to 5 percent of the Ah rating. The model shows what that range costs. At f = 0.70, cutting off at 0.10C instead of 0.02C saves about 0.97 hours and leaves the cell at 94.0 percent of the modelled full capacity. The Battery University figure of about 10 percent extra capacity from full saturation is the same trade seen from the other side.
| Cutoff | I_term | t_CV (h) | Total (h) | Capacity at cutoff |
| 0.02C (Panasonic) | 65 mA | 1.93 | 3.33 | 98.8% |
| 0.05C | 163 mA | 1.38 | 2.78 | 97.0% |
| 0.10C | 325 mA | 0.97 | 2.37 | 94.0% |
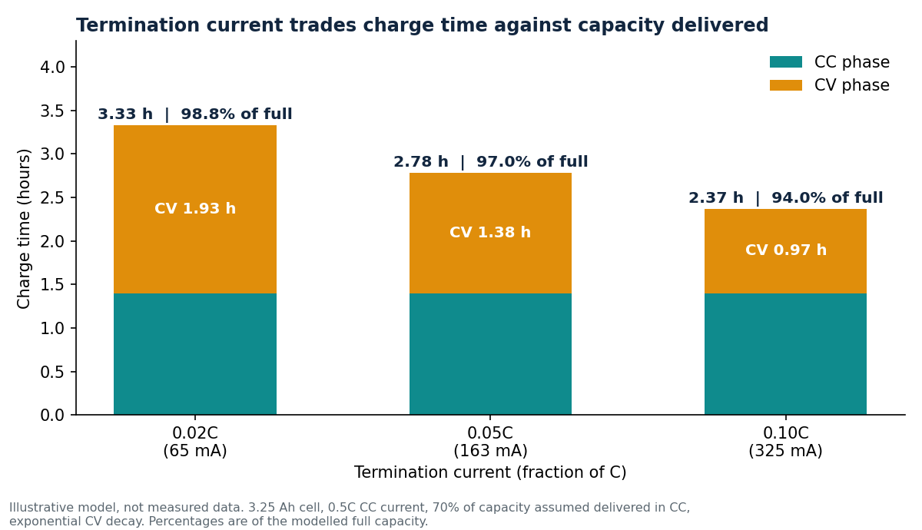
Figure 4. Effect of the termination current on charge time and capacity delivered.
Guides such as BatteryMBA’s that state a fixed 30 to 60 minute CV phase are implicitly assuming a large CC fraction and a cutoff near 0.05C. At f = 0.85 and 0.05C, the model gives tau x ln(10) = 0.69 hours, or about 41 minutes. The fixed figure is right for one design point and wrong for others.
Limitations. The model assumes constant temperature, an ideal exponential decay, and a CV current that starts at I_cc. Real cells show a transition region and temperature rise. Ageing also shifts the split: research on state-of-health estimation reports that CC time shortens and CV time lengthens as a cell ages. Battery University shows a related result, where a new and an aged pack take about the same time to charge but the aged pack ends with lower capacity. For the wider ageing picture, the battery degradation guide covers capacity loss in portable power stations.
What changes for LiFePO4
The EVE LF280K specification lists a 3.65 V CC-CV cutoff, a standard charge of 0.5C, a maximum charge current of 1C under 0 to 45 C, a charging temperature of 0 to 55 C, and a recommended state-of-charge window of 10 to 90 percent. Its standard test terminates at 0.05C. The datasheet’s reference charge times are 2.0 hours at 0.5C and 1.0 hour at 1C, which are exactly 1 divided by the C-rate. They are labelled reference values, so they are nominal figures and not measured full-charge times.
Two practical points follow. LiFePO4 cells state the same 0 C cold-charge floor as consumer NMC cells, so the cold-weather rule is not chemistry-specific. And the flat LFP voltage plateau means terminal voltage during CC says little about state of charge, so LFP systems rely on current integration in the BMS and on the current taper in CV to judge fullness. That last point is engineering reasoning and not a claim from the datasheet.
Worked Example 2: Charging a 12.8 V, 100 Ah LiFePO4 Battery from a 20 A Source
This example applies the same logic at pack level, where energy planning matters more than cell chemistry. A 100 Ah battery of this class is the format examined in the 100Ah lithium battery guide for Nigerian home backup.
Scenario. A 12.8 V (4S) battery sits at 20 percent state of charge and is refilled by a 20 A solar charge controller or DC charger.
Known values: capacity 100 Ah, nominal voltage 12.8 V, energy to add 80 Ah, source current 20 A, absorption timer 2 h (the Victron LiFePO4 default), assumed charge-path efficiency 95 percent.
Charge rate = 20 A / 100 Ah = 0.2C
Energy added = 80 Ah x 12.8 V = 1,024 Wh
Energy drawn from source = 1,024 Wh / 0.95 = 1,078 Wh
Bulk time, first order = 80 Ah / 20 A = 4.0 h
Approx. bulk power = 20 A x 13.4 V = 268 W
Result. The battery is charged at a gentle 0.2C. The charger is active for roughly 4 hours in bulk plus up to the 2 hour absorption timer, so about 4 to 6 hours in total, provided the source can hold 20 A. The 13.4 V figure is an assumed average bulk voltage, since LiFePO4 voltage stays relatively flat through most of the charge.
Practical meaning. With solar, the limit is usually array power, not the controller’s current rating. Holding 20 A into this battery takes about 270 W at the battery terminals, before losses and before real-world irradiance. The solar panel sizing guide covers that derating for portable power stations, and the same logic applies to battery banks.
Limitation. The 95 percent efficiency is an assumption, not a measured value. The 4 hour figure assumes all 80 Ah arrives at 20 A. In practice current tapers as the battery nears the absorption voltage, so part of the charge arrives during absorption, the bulk stage ends before the 4 hour mark and total charge time runs longer.
Worked Example 3: Sizing the Charger for a 51.2 V, 100 Ah LiFePO4 Bank
Charger sizing is where cell limits meet hardware. The EVE cell specification allows up to 1C, and its standard charge is 0.5C, so a 100 Ah bank has a cell-level ceiling of 100 A and a standard rate of 50 A. The pack maker’s BMS limit is usually lower and takes priority.
Known values: 16 cells in series (16S), 100 Ah, nominal 51.2 V, energy 5,120 Wh, charge 20 to 100 percent, charge current 50 A (0.5C), absorption setpoint 56.8 V (the Victron default of 3.55 V per cell), assumed charger efficiency 95 percent.
DC power at end of bulk = 50 A x 56.8 V = 2,840 W
Energy to add = 80 Ah x 51.2 V = 4,096 Wh
Energy from source = 4,096 Wh / 0.95 = 4,312 Wh
AC input at 2,840 W DC = 2,840 / 0.95 = 2,989 W, about 13 A at 230 V
Bulk time, first order = 80 Ah / 50 A = 1.6 h
Result. The charger needs a DC output rating of at least 2.84 kW at 56.8 V, not the 2.56 kW you get by multiplying 50 A by the 51.2 V nominal voltage. Sizing on nominal voltage undersizes the charger because output voltage rises during the charge. The AC input calculation assumes a power factor of 1.0. A real charger with a lower power factor draws more current for the same power.
Practical meaning. On a generator, a 3 kW charge draw consumes most of a small unit’s capacity before any household load is added. Lowering the charge current is the correct fix. Charging at 25 A halves the input power to roughly 1.5 kW and roughly doubles the bulk time to 3.2 hours. The cell datasheet does not object, because 0.25C is below its standard 0.5C rate.
Limitation. The 95 percent efficiency, the unity power factor and the 230 V figure are assumptions. Real mains and generator voltage varies, and AC input current rises when supply voltage sags.
Charging on an Unstable Supply
In areas with frequent outages and variable mains or generator output, the charger is repeatedly interrupted and restarted. Lithium chemistries tolerate this if termination logic is correct, because each restart begins from the present cell voltage. The failure modes are different.
- Restart from a full battery. A charger that returns to CC after every interruption can push a full pack back into the absorption stage repeatedly. Controllers use a re-bulk threshold to prevent this. Victron’s lithium default is the float voltage minus 0.1 V, and one published controller manual quotes a return to bulk at 13.4 V for LiFePO4, both consistent with Figure 5.
- Input under-voltage. A charger on sagging input either derates or stops, and charge time extends. Check the charger’s input voltage range before blaming the battery.
- Generator quality. A generator under a full charge load on a marginal fuel or engine supply produces unstable voltage and frequency. Limit charge current so the charger sits well below the generator rating.
- Heat. Long charge sessions on warm days and in closed rooms add cell temperature. See the temperature section for the life penalty.
Verifying That a Charger Is Doing What It Claims
Three measurements reveal most charging faults: terminal voltage, charge current and cable voltage drop. A multimeter or clamp meter is enough, provided the instrument and procedure are safe for the current involved.
- Voltage at the battery terminals, not at the charger. During the CV stage, the voltage at the battery terminals should sit at the absorption setpoint within the meter’s accuracy and the cable drop. A reading well below the setpoint late in a charge points to cable or connection loss, or to a BMS limiting charge.
- Current with a DC clamp meter. Handheld multimeters usually fuse their current input at 10 A or less, so measuring 50 A in series with one is unsafe. Use a DC-capable clamp meter and watch the current fall through CV. A current that never tapers suggests the charger is not in CV or the battery is not accepting charge.
- Cable drop. Measure voltage across each cable while charging. Compare against the calculation below.
- Safety. Use an instrument with a category rating suited to the system. Keep tools away from the two terminals. Remove metal jewellery. Do not bridge terminals with a probe.
Cable drop example. A 12.8 V, 100 Ah battery charged at 50 A through 3 m of cable each way, 25 mm2 copper. Resistivity of copper is 0.0172 ohm mm2 per metre at 20 C.
R = 0.0172 x 6 m / 25 mm2 = 0.00413 ohm
V_drop = 50 A x 0.00413 = 0.206 V
P_loss = 50 squared x 0.00413 = 10.3 W
A 0.2 V drop against a 14.2 V absorption setpoint means the battery sees about 14.0 V, or 3.5 V per cell, when the charger believes it is delivering 14.2 V. The battery ends up slightly under-charged and the cable dissipates about 10 W. Shorter or thicker cable and controllers with a voltage-sense input reduce the error. The resistance value ignores connection resistance and temperature rise, so real drop is somewhat higher.
Temperature: The Limit That Damages Cells Without Warning
Cold: lithium plating
Graphite must accept lithium ions faster than they arrive. When it cannot, the anode potential is driven toward 0 V against lithium metal and metallic lithium deposits on the surface instead of intercalating. Low temperature, high current and cell ageing all push the anode toward this condition. A 2025 mechanism study of graphite electrodes examined this competition between intercalation and plating across temperatures from 30 C down to -40 C.
Battery University states that consumer-grade lithium-ion cells cannot be charged below 0 C, that the pack can appear to charge normally while plating occurs, and that the result is permanent degradation in performance and safety. It cites research allowing 0.02C at -30 C, which would stretch charge time beyond 50 hours. Its safety article notes that some manufacturers permit charging down to -10 C at 0.1C, taking 12 to 15 hours on an empty battery.
LiFePO4 is not exempt. In a 5 Ah LFP/graphite pouch-cell study, a modified graphite retained 66.86 percent of room-temperature capacity when charged at -20 C and 0.5C, which the authors report as 20 times higher than pristine graphite. The EVE cell specification sets a charging range of 0 to 55 C. Some plating is partially reversible, but that is a research finding on specific cells and not a basis for cold charging in service.
| Condition | Guidance | Source |
| Consumer Li-ion, ambient below 0 C | Do not charge | BU-410 |
| Reduced-rate cold charging, down to -10 C | Some manufacturers allow 0.1C | Battery University safety article |
| NCR18650B standard charge | Ambient 10 to 45 C | Panasonic datasheet |
| EVE LF280K LiFePO4 cell | Charge 0 to 55 C, max current 1C within 0 to 45 C | EVE specification |
| Victron LiFePO4 default | Low-temperature cut-off set to 5 (controller setting) | Victron manual |
Heat: ageing
Heat accelerates degradation. BU-502 reports that cycle life is reduced by 20 percent at 30 C and 40 percent at 40 C compared with operation at 20 C or slightly below. In regions where ambient temperature regularly reaches 30 C or higher, including much of Nigeria, heat is the more likely constraint than cold. An enclosed battery cabinet next to an inverter can run well above room temperature. Ventilation and placement affect service life as much as the charging profile does. The maintenance guide covers placement and storage for portable power stations.
What the BMS Does During Charge
A battery management system (BMS) sits between charger and cells. It monitors each series group, cuts charging when any cell exceeds its voltage limit or temperature window, and equalizes cell voltages. It is a protection layer, not a charging algorithm. The charger still needs correct setpoints.
Series strings expose the cell-matching problem. A pack enters CV when the first cell reaches its full-charge voltage, as EVreporter describes, so a weak or low-capacity cell can pull the whole pack into CV before the others are full. Balancing during the CV or absorption phase corrects the spread. Victron’s LiFePO4 defaults reflect this: its documentation sets tail current to 0 A so the full 2 hour absorption time is available for cell balancing. Ending absorption early on a pack that needs balancing leaves the spread in place.
BMS temperature limits interact with charge planning. A pack with a low-temperature charge cut-off will refuse charge on a cold morning, and a solar charge controller will report no charge current. That is correct behavior, not a fault.
Charging From Solar and Off-Grid Sources
Solar changes three things: current is variable, the source may not reach the absorption voltage on some days, and the charger profile is set by the installer rather than fixed in a device. The last one is where most damage occurs.
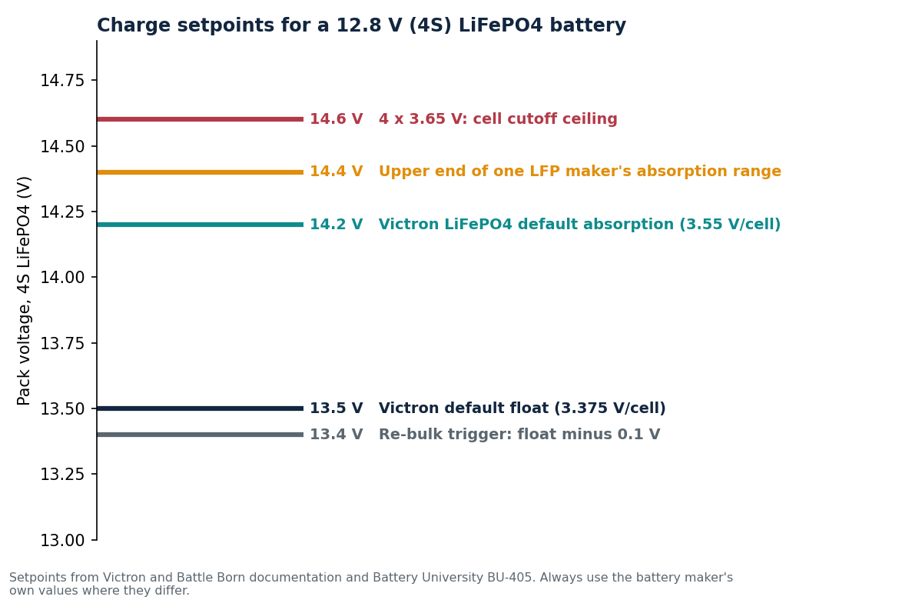
Figure 5. Charge setpoints for a 12.8 V (4S) LiFePO4 battery from cited sources. Use the battery maker’s own values.
Victron’s default LiFePO4 settings are absorption 14.2 V (28.4 V and 56.8 V for 24 V and 48 V systems), a fixed 2 hour absorption time, float 13.5 V, equalization disabled, temperature compensation disabled and a low-temperature cut-off of 5. Victron also states that these can be adjusted if the battery manufacturer’s specification says otherwise. Battle Born’s published controller guide specifies absorption of 14.4 to 14.6 V with 30 minutes per 100 Ah, float of 13.6 V or lower, and temperature compensation off. Both sit below the 14.6 V cell ceiling.
Sources disagree on float. Battery University advises against float on lithium chemistries because prolonged float can shorten life, while both Victron and Battle Born publish float voltages for LiFePO4. The defensible position is to use the specific battery’s datasheet and the value the maker warrants. Where a battery is used as a daily-cycled buffer with the load on the same bus, float behavior matters less than a correct absorption setpoint.
Cloudy days are not a charging failure. Battery University notes that lithium-ion does not need to be fully charged and that a partial charge is better. Solar systems that cycle daily between partial states of charge are working within what the chemistry prefers. Lead-acid equalization must be disabled, since it exists to push voltage above normal absorption to correct sulfation, a lead-acid problem.
Portable power stations manage all of this internally. The charger, MPPT stage and BMS are built into the unit, as described in the portable power station operating principles guide, and the usable energy figures are explained in the battery capacity guide. The setpoint decisions above apply to DIY battery banks and separately purchased batteries.
Assumption Register
| Assumption | Value | Why used | Effect if wrong |
| CC fraction f (Example 1) | 0.60, 0.70, 0.85 | Not in datasheet; bracketed | Total time moves between 2.7 and 3.8 h |
| Termination current (Example 1) | 0.02C, 0.05C, 0.10C | Range of published cutoffs | About 1 h of time and 5 percent of capacity |
| CV current shape | Exponential | Standard first-order model; consistent with Keysight | Real tail may be longer or shorter |
| Cell capacity | 3.25 Ah | Datasheet nominal minimum | Typical is 3.35 Ah, so real time is slightly longer |
| Charge-path efficiency (Example 2) | 95 percent | Assumed for planning | Source energy scales as 1 / efficiency |
| Average bulk voltage (Example 2) | 13.4 V | Assumed mid-range LiFePO4 bulk value | Bulk watts scale linearly with voltage |
| Charger efficiency and power factor (Example 3) | 95 percent, 1.0 | Assumed for planning | AC input current scales as 1 / (efficiency x power factor) |
| Mains voltage (Example 3) | 230 V | Assumed nominal | Sagging supply raises input current |
Common Charging Mistakes
| Mistake | Why it seems reasonable | Consequence | Correct practice |
| Using a lead-acid profile on LiFePO4 | Same 12 V nominal, connector fits | Lead-acid equalization is listed at 15.8 to 16.1 V. On 4S that is 3.95 to 4.03 V per cell, above the 3.65 V ceiling. BU-409b notes a lead-acid charger limited to 14.4 V and without float can be tolerated but under-charges LFP | Select a lithium preset, disable equalization |
| Charging below 0 C | The battery still accepts current | Plating with permanent damage (BU-410) | Warm the pack or use a BMS that blocks cold charge |
| Sizing a charger on nominal voltage | 50 A x 51.2 V looks like the load | Output voltage rises toward 56.8 V, so real power is about 11 percent higher | Size on maximum charge voltage |
| Trusting the 100 percent reading | Charger shows ready | Some chargers stop before saturation; BU-409 warns a 100 percent fuel-gauge reading can be misleading | Check the actual termination logic |
| Ending absorption early on multi-cell packs | Pack is at voltage already | Cell imbalance persists | Keep the maker’s absorption time |
| Leaving a battery full for long storage | Ready for use | Higher stress at high voltage; BU-409 suggests 40 to 50 percent for storage | Store partially charged when idle for long periods |
| Treating charger wattage as charge speed | Higher watts should mean faster | Cell and BMS limits cap current, not the charger | Size the charger to the battery C-rate |
Safety Limits
- Use a charger matched to the battery’s chemistry, series count and stated current limit. The BMS is a backstop and not a substitute.
- Stop charging if the battery is swollen, hissing, or unusually hot. BU-409 advises discontinuing use when temperature rises more than 10 C at moderate charging speeds.
- Quality cells in certified packs are safe when used as intended. Battery University attributes many reported incidents to non-certified cells, and lists elevated heat and sub-freezing charging as incorrect uses.
- Do not bypass or reprogram a BMS. Fusing, wire sizing and DC wiring on large banks should follow the battery maker’s instructions and the applicable local code, and complex installations warrant a qualified installer.
Frequently Asked Questions
Should a lithium-ion battery be charged to 100 percent?
Not always. Battery University states that lithium-ion does not need a full charge and that a partial charge is better for life. Charging to 100 percent is appropriate when the full capacity is needed for the next discharge.
Why does the last 10 to 20 percent take so long?
The CV phase holds voltage while current decays, and that phase carries the final fraction of capacity. In the model above, CV takes 1.9 hours of a 3.3 hour charge. See Figure 2.
Can any charger with the right connector charge a lithium battery?
No. Voltage ceiling, current limit and termination logic must match the cell chemistry and series count. A 4S LiFePO4 pack has a 14.6 V ceiling, while a 3S NMC pack tops out at 12.6 V.
Is fast charging bad for the battery?
Higher currents raise the risk of lithium plating and heat, and cycle life generally falls as charge rate rises. Cell design and temperature control determine how much. Multi-stage charging methods that step current down ahead of the CV phase are an active research area aimed at reducing time without adding degradation.
Is it safe to leave a lithium battery on the charger?
That depends on the charger’s termination behavior and the battery maker’s guidance. Battery University notes that some chargers apply a brief topping charge to compensate for self-discharge, while BU-409b warns that prolonged float on LiFePO4 can shorten life. Follow the battery datasheet.
Conclusion
Lithium-ion charging is a voltage-limited process with a current-limited first half. The ceiling voltage per cell, the termination current, the C-rate and the cell temperature determine both time and battery life. Correct setpoints matter more than charger power. A cell charged at 4.20 V per cell, at moderate temperature, at 0.5C or below, with a termination current of a few percent of C, sits within the ranges given by the sources cited in this guide.
For DIY and off-grid systems, chemistry-specific setpoints are the point of failure. Confirm the series count, use the battery maker’s absorption and float values, disable equalization, and check the low-temperature cut-off before commissioning.
Next step: size the source that will feed the battery with the solar panel sizing guide, then estimate discharge time with the runtime calculation guide.