Why Battery Capacity Decreases Over Time
Quick answer.
Battery capacity decreases because slow side reactions permanently consume the lithium that carries charge and damage the electrodes that store it. The rate of that damage is set mainly by temperature, time spent at high state of charge, charging power, and total energy cycled.
Formula: State of Health (SOH, %) = (Q_now ÷ Q_new) × 100, where Q is the measured full-charge capacity in Ah or Wh.
Total fade is approximately calendar fade plus cycle fade. Example: A 1,000 Wh (nominal) power station at 85% SOH holds about 850 Wh. Through an AC inverter path with the site planning factor of 0.80 (0.95 usable depth of discharge × 0.85 inverter efficiency), it delivers about 680 Wh to the load, against 800 Wh when new. Real-world adjustment: Heat and long spells at full charge often matter more than the cycle count printed on the datasheet.
Every lithium battery starts losing capacity from its first charge, and most owners meet the effect as a shorter runtime rather than a failure. The useful question is not whether a pack will fade, but which mechanisms drive the loss, how fast each one runs under real operating conditions, and how much capacity should be planned for after two, five, or eight years.
This guide separates the chemistry from the folklore. It explains what is physically lost, why time alone ages a battery, how much heat really accelerates the process (with a calculation that corrects a common rule of thumb), and how calendar aging and cycling trade places depending on how a battery is used. Lead-acid batteries, which still turn up in many backup installations and fail in different ways, get their own section, followed by what the temperature record implies for Nigerian conditions. For the cycle-count view of the same subject, see battery cycle life explained; for a power-station-specific look at wear, see portable power station battery degradation.
What “losing capacity” actually means
Capacity is the charge (Ah) or energy (Wh) a fully charged battery can deliver under stated conditions. It is not one fixed number. Cold temperatures, high discharge rates, and an inaccurate state-of-charge estimate can all make a healthy battery deliver less on a given day. Those effects are temporary and reverse when conditions change.
Permanent fade is different. It is measured as State of Health, the ratio of today’s full-charge capacity to the capacity when new. Rated cycle life is conventionally quoted as the number of cycles until SOH reaches 80%, which is why 80% is often called end of life. It is a rating convention, not a cliff. A pack at 78% still works; it simply no longer meets the rating.
The difference between Ah and Wh matters here as well: capacity in Ah says nothing about energy until nominal voltage is applied. See Wh vs Ah explained for the conversion used throughout this article.
Where the lost capacity goes: three degradation modes
Dozens of chemical and mechanical processes operate inside a cell, but their measurable effects can be summarised as three degradation modes. Birkl and colleagues at the University of Oxford gave experimental evidence for this framework in the Journal of Power Sources in 2017: loss of lithium inventory, loss of active positive electrode material, and loss of active negative electrode material.
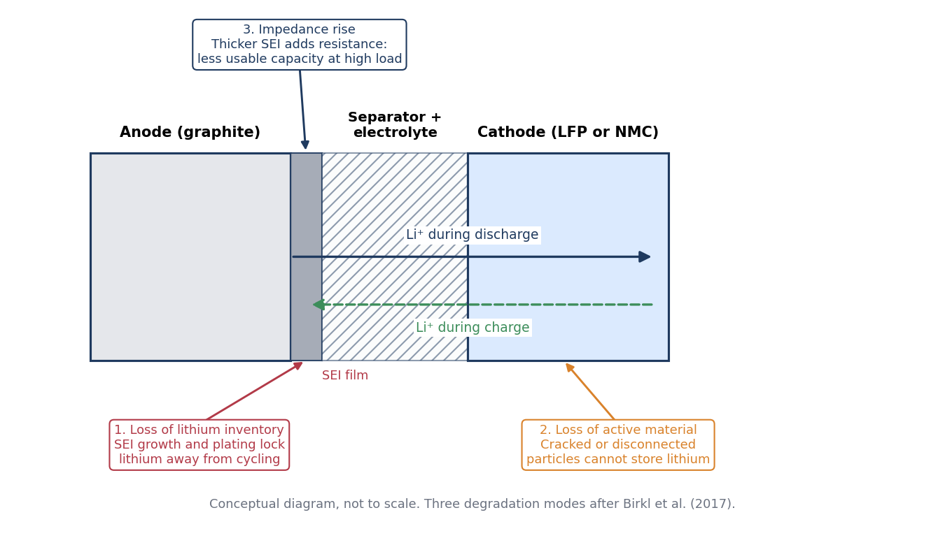
Figure 1. The three degradation modes in a lithium-ion cell. Conceptual diagram, not to scale. Framework after Birkl et al. (2017); impedance rise is added as the commonly reported third effect on usable power.
- Loss of lithium inventory (LLI). Lithium ions are consumed by side reactions and are no longer available to shuttle between electrodes. In LFP/graphite cells, post-mortem and modelling work attribute the fade mainly to this mode, tied to side reactions at the anode (Wang et al., 2011). It is why capacity fades even when nothing is visibly damaged.
- Loss of active material (LAM). Electrode particles crack, lose electrical contact, or are blocked by surface layers, so they can no longer host lithium. Forensic work by Ohio State University, Oak Ridge National Laboratory, and NIST, summarised by Battery University, found coarsened electrode nanomaterials and lithium permanently lodged on the anode. Chemistry matters here: a 2018 post-mortem study of commercial graphite/LiFePO4 cells found the LiFePO4 electrodes showed only minimal signs of degradation at every cycling temperature tested, while a modelling study of high-nickel layered-oxide cathodes predicted that loss of positive-electrode active material dominates fade in usable capacity. LAM is therefore a bigger story for NMC-type chemistries than for LFP.
- Impedance rise. Growing surface films and degraded contacts raise internal resistance. Rated capacity may look intact at low current, but less energy is reachable at high load before the voltage limit is hit, and more energy is wasted as heat.
The main mechanisms behind the fade
Solid electrolyte interphase growth: the loss that never fully stops
The first charges form a thin film, the solid electrolyte interphase (SEI), on the graphite anode. It is useful because it stops the electrolyte from decomposing continuously. It is also imperfect. The film keeps thickening slowly, and each increment consumes lithium and electrolyte. Battery University, drawing on work by Jeff Dahn’s group, describes coulombic efficiency as the measure of this loss: a cell with a coulombic efficiency of exactly 1.000000 would in principle last indefinitely, while a very good cell reaches about 0.9999.
That figure makes the scale concrete. A shortfall of 0.0001 per cycle means roughly 0.01% of the cycling lithium is lost each cycle to parasitic reactions, before any other mechanism is counted. Small, constant, and unavoidable: this is the baseline fade.
Lithium plating: cold or fast charging
When lithium ions arrive at the anode faster than graphite can absorb them, or when the anode is cold and diffusion is slow, metallic lithium can deposit on the surface instead of entering the graphite. Plated lithium is partly irreversible, consumes cyclable lithium like the SEI does, and is a safety concern as well as a capacity loss. This is why battery management systems restrict charging at low temperatures.
Diagnostic work on commercial cells cycled at -10 °C (Birkl et al., Journal of The Electrochemical Society, 2017) is a good entry point to the evidence. In the LiFePO4 cycle-life study cited below, data at 0 °C did not follow the Arrhenius fit at all, which the authors took as a sign that a different decay mechanism operates at low temperature.
Electrolyte decomposition and cathode interface changes
At high voltage and high temperature the electrolyte oxidises and decomposes, producing compounds such as lithium fluoride that build up in both the anode SEI and the cathode-electrolyte interphase. A calendar-aging study of LiFePO4/graphite pouch cells by Logan, Dahn and co-authors (ACS Applied Energy Materials) tested 50% and 100% state of charge at 25 °C and 50 °C. Both raised capacity loss, and temperature had the more pronounced effect of the two, consistent with continuous electrolyte decomposition.
Particle cracking and mechanical strain
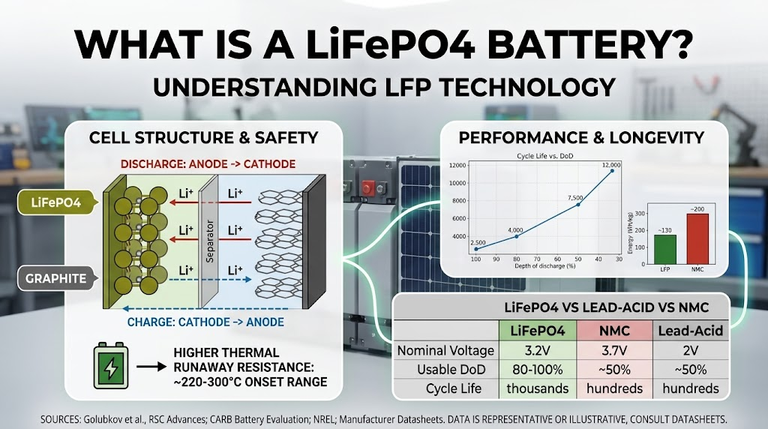
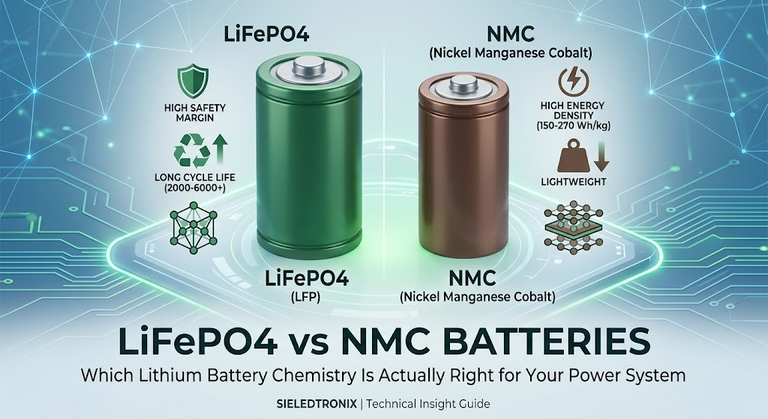
Electrode materials expand and contract as lithium moves in and out. Repeated strain cracks particles and breaks electrical contacts, which drives loss of active material and scales with the energy cycled. This is one reason cycle life ratings differ so much between chemistries: manufacturers such as Anker SOLIX rate LiFePO4 power stations at roughly 4,000 cycles to 80% capacity, against a typical 500 to 1,000 cycles for NMC packs under the same threshold.
Those are manufacturer statements, not independent tests, but the ratio is consistent with the wider industry picture. Wang et al. link lithium consumption in LFP/graphite cells to the repair and growth of SEI on a cracked carbon anode. Chemistry detail is covered in LiFePO4 vs NMC batteries.
Calendar aging versus cycle aging
Two aging clocks run at once. Calendar aging proceeds with time whether or not the battery is used, driven by temperature and storage state of charge. Cycle aging accumulates with charge throughput, depth, and rate. Most competing explanations treat them as one, which produces the wrong advice for a backup unit that sits idle for months.
The best-documented LiFePO4 calendar dataset is the Technical University of Munich study by Naumann and co-authors: 17 storage conditions, three cells each, tracked for 29 months on a commercial Sony/Murata LFP/graphite cell, with a five-parameter model that predicted a separate validation set to within 2.2 percentage points of capacity loss. Its authors note that the widely observed square-root-of-time capacity fade may partly reflect a reversible lithium exchange with anode overhang areas, and that other researchers found linear fade at moderate temperatures. In plain terms, the shape of the curve is still debated, so straight-line projections are approximations.
Wang et al. (HRL Laboratories, General Motors, and John Deere; Journal of Power Sources 196, 2011) reported the same pattern from the cycling side. They tested A123 2.2 Ah 26650 LiFePO4/graphite cells from -30 °C to 60 °C, at 10% to 90% depth of discharge and C/2 to 10C.
At C/2, capacity fade was governed mainly by time and temperature, depth of discharge added little once fade was plotted against time or throughput, and fade followed a power law with an exponent of 0.552, close to a square root. Both conclusions point the same way. For this chemistry, how warm the cell is and how long it has existed often outweigh how deeply it is discharged. For the depth question specifically, see battery depth of discharge explained.
Heat: how much faster does a warm battery age?
Parasitic reactions follow Arrhenius behaviour: their rate rises exponentially with absolute temperature. The acceleration factor relative to a reference temperature is:
AF = exp[ (Ea ÷ R) × (1 ÷ T_ref − 1 ÷ T) ] AF = aging rate relative to the reference (dimensionless) | Ea = activation energy (J/mol) | R = 8.314 J/(mol·K) | T_ref = 298.15 K (25 °C) | T = cell temperature (K)
Worked example. Take a cell held at 35 °C (308.15 K) instead of 25 °C, using Ea = 31,500 J/mol from the graphite/LiFePO4 cycle-life model.
- 1/T_ref − 1/T = 1/298.15 − 1/308.15 = 0.00010885 K⁻¹
- Ea ÷ R = 31,500 ÷ 8.314 = 3,788.7 K
- AF = exp(3,788.7 × 0.00010885) = exp(0.4124) = 1.51
That is the rate of loss. What an owner cares about is life: how long before capacity reaches 80%. Wang et al. found capacity loss follows a power law in charge throughput with exponent z = 0.552 (close to a square root). Under a power law, the time to reach a fixed loss scales as AF raised to the power of -1/z. At 35 °C: 1.51 ^ (1 ÷ 0.552) = 1.51 ^ 1.812 = 2.11, so life is about 47% of the 25 °C value. At 45 °C: 2.22 ^ 1.812 = 4.25, so life falls to about 24%.
This corrects a mistake that is easy to make. Ten degrees of extra heat raises the instantaneous loss rate by about 50%, but it roughly halves service life, because the power-law fade compounds the effect. The familiar rule that life halves for every 10 °C therefore holds up for the LFP cycling data, as a statement about life and not about rate. Battery University’s guideline for sealed lead-acid is that each 8 °C halves life, which works out to a factor of 2.4 per 10 °C, slightly harsher than the 2.1 derived for LFP here.
The lower activation energy of 17,126 J/mol attributed to the Naumann calendar model gives a gentler result: a rate factor of 1.25 at 35 °C and, assuming a square-root law, a life factor of about 1.6. These values were fitted to specific LFP/graphite cells, so they show order of magnitude, not a guarantee for any product.
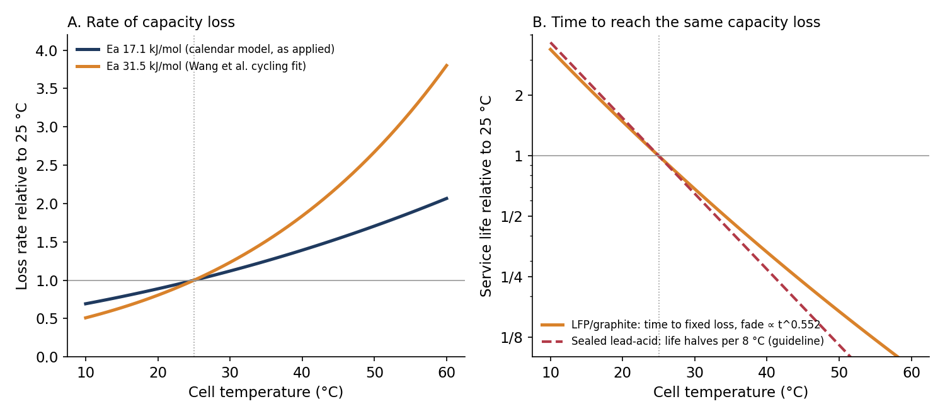
Figure 2. Calculated effect of temperature. Panel A: Arrhenius rate factor. Panel B: time to reach the same capacity loss, using the fitted power law (z = 0.552) for LFP and the Battery University halving guideline for sealed lead-acid. Calculations from published parameters, not measurements of any specific product.
| Cell temperature | Rate factor (Ea 31.5 kJ/mol) | Relative life to same loss | Cycles to 80% (Wang model) |
| 15 °C | 0.64 | 2.2 × | about 19,100 |
| 25 °C | 1.00 | 1.0 × | about 8,600 |
| 35 °C | 1.51 | 0.47 × | about 4,100 |
| 45 °C | 2.22 | 0.24 × | about 2,000 |
| 60 °C | 3.80 | 0.09 × | about 770 |
The last column applies the Wang et al. model at C/2 and 100% depth of discharge to a 2011-vintage 2.2 Ah cell held at constant temperature; 25 °C and 35 °C are interpolated between the fitted 15, 45, and 60 °C data. It predicts roughly 8,600 full cycles to 80% at 25 °C and about 2,000 at 45 °C. Modern power-station cells and their 4,000-cycle ratings are different designs tested under different conditions, so these are not predictions for any product. They show how strongly a cycle rating depends on temperature, and a rating quoted without a test temperature is incomplete.
Geotab’s fleet analysis of more than 22,700 electric vehicles found vehicles in hotter regions degraded about 0.4 percentage points per year faster than those in mild climates, a real but modest effect for actively managed automotive packs. Unmanaged storage in a hot enclosure is likely a harsher case.
State of charge and voltage
Higher state of charge means higher anode potential and a more aggressive environment for the electrolyte. A physics-based simulation of LiFePO4/graphite cells attributes stronger SEI growth at high SOC to electrolyte instability at elevated anode potentials, and the Logan/Dahn measurements confirm that 100% SOC storage costs more capacity than 50%, though less than the temperature change did.
Battery University’s guidance for consumer lithium-ion cells (cobalt-based, 4.20 V per cell) gives a sense of the voltage effect: a cell charged to 4.20 V typically delivers 300 to 500 cycles, while 4.10 V is quoted at 600 to 1,000 and 4.00 V at 1,200 to 2,000, at the price of stored capacity. Those exact numbers are contested, since the source does not cite its data and critics argue depth of discharge is a poor predictor compared with end-of-charge voltage. LiFePO4 has a much flatter voltage curve and a different operating window, so the figures should not be transferred to it. What transfers is the direction: lower end-of-charge stress, longer life.
Real fleets temper the advice. Geotab found that vehicles regularly using a wide state-of-charge range did not degrade meaningfully faster unless they spent prolonged, habitual periods near full or near empty. The defensible reading is that sitting at the extremes is the problem, not the act of using the capacity. Anker SOLIX recommends storing a power station at 40% to 60% charge when it will sit unused for more than a month; this is manufacturer guidance consistent with the calendar-aging evidence.
Charging power and discharge rate
High current pushes lithium into the anode faster than it can diffuse, raising plating risk, and it heats the cell through internal resistance. Geotab’s data shows the scale in automotive use, summarised below. These are EV fleet figures, so the direction transfers to other lithium packs but the magnitudes do not.
| Usage pattern (Geotab, 22,700+ EVs) | Average annual degradation |
| Fleet average | 2.3% per year (81.6% SOH projected after 8 years) |
| Predominantly AC or lower-power charging | about 1.5% per year |
| Heavy DC fast charging above 100 kW | up to 3.0% per year |
| Hot regions versus mild climates | about 0.4 percentage points per year faster |
Note that Geotab’s 81.6% figure equals a straight-line loss of 2.3% × 8 = 18.4%. Compounding the same rate would give 83.0%. The difference is small, but it shows why fleet averages are best read as summaries rather than laws. See battery C-rate explained for how charge and discharge rates are defined.
Lead-acid batteries: a different set of failure modes
Lead-acid batteries lose capacity through different mechanisms, and the advice that protects a lithium pack can damage a lead-acid bank. The dominant wear process is sulfation. Battery University states that it occurs when a lead-acid battery is deprived of a full charge, and that a full charge needs periodic saturation of 14 to 16 hours.
Solar and wind sources do not always deliver that, which is one route to short life. As an illustration it cites wheelchair batteries lasting about two years while golf cars using the identical battery deliver twice the service life, because long idle periods let golf car batteries recharge fully overnight. It also lists grid corrosion, active-material shedding, and internal short circuits as separate mechanisms (BU-804a).
Other differences follow from the construction. Flooded batteries can suffer acid stratification; Battery University notes that AGM does not, and that AGM is less sensitive to sulfation when undercharged than the flooded version. Deeper discharge shortens life. Temperature acts strongly: as a guideline, each 8 °C rise cuts the life of a sealed lead-acid battery in half, so a stationary VRLA battery specified for 10 years at 25 °C would last about 5 years at a constant 33 °C and about 30 months at 41 °C. The same source observes that flooded lead-acid batteries are well suited to hot climates.
Life at a constant temperature (sealed lead-acid guideline): L(T) = L25 × 2 ^ ( -(T – 25) ÷ 8 ) L25 = rated life at 25 °C | T = battery temperature in °C | Check: 10 years at 25 °C gives 10 × 2 ^ (-16 ÷ 8) = 2.5 years at 41 °C, matching the Battery University figure of 30 months.
| Driver | LiFePO4/graphite | Sealed lead-acid |
| Main capacity-loss mechanism | Loss of cyclable lithium (SEI growth, plating) | Sulfation, grid corrosion, shedding |
| Risk of staying at full charge | Adds calendar loss, mostly a second-order effect to temperature | Low. Staying undercharged is the danger |
| Risk of staying undercharged | Little calendar penalty at moderate charge | Sulfation, faster capacity loss |
| Heat sensitivity (guideline) | Life roughly halves per 8 to 10 °C | Life halves per 8 °C |
| Deep discharge | Depth added little to fade at C/2 (Wang et al.) | Deeper discharge shortens life |
The practical warning is a reversal. For lithium, prolonged time at 100% and at high temperature is the concern. For lead-acid, prolonged time below full charge is the concern, so a habit of keeping a lead-acid inverter bank partly charged to “save the battery” works against it. Both chemistries share the heat problem.
Operating conditions in Nigeria: what the temperature record implies
The temperature figures below are sourced, the table is arithmetic, and the final paragraph is reasoning; each is labelled. Sourced: according to Encyclopaedia Britannica, mean monthly maximum temperatures on the Nigerian coast are steady through the year at about 32 °C in Lagos, with mean monthly minima near 22 °C; in the north, Maiduguri’s mean monthly maximum may exceed 38 °C in April and May. Laboratory data, including the studies above, are referenced to 25 °C.
Arithmetic: a room at the midpoint of the Lagos daily range (about 27 °C) is already above the reference. Applying the life rules from this article at constant temperature:
| Battery temperature | LFP relative life (z = 0.552 model) | Sealed lead-acid relative life | 10-year lead-acid battery lasts |
| 25 °C (reference) | 1.00 | 1.00 | 10.0 years |
| 27 °C (room at Lagos daily midpoint) | 0.86 | 0.84 | 8.4 years |
| 35 °C (closed cupboard or warm inverter bay) | 0.47 | 0.42 | 4.2 years |
| 40 °C (hot-season enclosure, north) | 0.33 | 0.27 | 2.7 years |
These are calculated from the rules above at constant temperature. Real temperatures swing through the day, and hot hours weigh more heavily than cool ones, so the table describes a scenario and not a forecast. Battery temperature is also not room temperature: it sits above ambient when the pack is under load or beside inverter electronics.
Reasoning, not measured Nigerian field data (no Nigerian field study of battery fade was found in this research): inverter systems commonly hold their batteries at or near full charge whenever grid or solar supply is present, which for lithium combines high state of charge with heat, while long outages followed by short grid hours can leave lead-acid banks chronically undercharged and prone to sulfation. Which of these applies depends on the installation, and the battery-management or inverter charge settings decide it.
Actions that follow from the evidence: place batteries in the coolest ventilated space available, away from roof voids and inverter heat; measure battery temperature rather than assuming it; keep lead-acid banks fully recharged whenever possible; use the charge-limit or float settings the manufacturer supports for lithium banks; and size for about 80% of nameplate energy at end of life. For a product-level view, see best 100Ah lithium battery for home backup in Nigeria.
Years to 80% ≈ 20 ÷ (0.005 × N + c) N = full equivalent cycles per year | c = calendar loss in percentage points per year | 0.005 = cycling loss per cycle from a 4,000-cycle rating
Which clock dominates: calendar or cycling?
A rated life of 4,000 cycles to 80% capacity implies a loss budget of 20 percentage points over 4,000 cycles, or 0.005% per full equivalent cycle. That cycling loss can be added to a calendar loss rate to estimate years to 80%. The calendar rates below (0.5%, 1.0%, and 2.0% per year) are assumptions chosen to show sensitivity, not measured values for any product. They are chosen to bracket the all-in fleet figures in Geotab’s data (about 1.5% per year for the gentlest charging group and 2.3% on average, for electric vehicles that are not all LFP), so they are a plausible order of magnitude and not an LFP measurement.
| Cycles per year | Cycling loss (%/yr) | Years to 80%, c = 0.5 | c = 1.0 | c = 2.0 |
| 50 (occasional backup) | 0.25 | 26.7 | 16.0 | 8.9 |
| 150 (frequent outages) | 0.75 | 16.0 | 11.4 | 7.3 |
| 365 (daily solar cycling) | 1.83 | 8.6 | 7.1 | 5.2 |
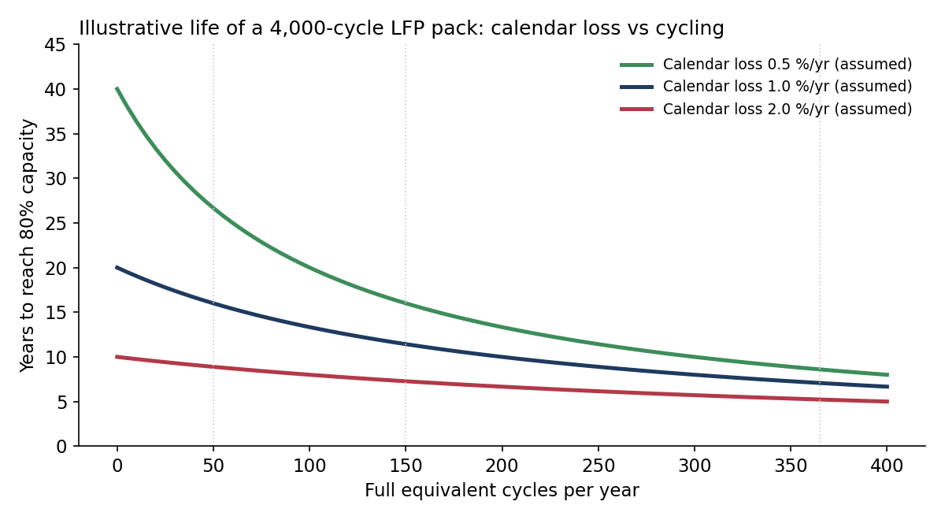
Figure 3. service life to 80% capacity. Calculated from a 4,000-cycle rating and calendar loss rates; the additive linear model is a simplification.
The result reorders common advice. For a backup unit cycled about 50 times a year, calendar aging at 1% per year accounts for 80% of total loss (1.0 ÷ 1.25), so storage temperature and time at full charge matter more than cycle count. For a daily-cycled solar system the split reverses: cycling accounts for about 65% (1.83 ÷ 2.83) and depth and rate matter more.
The model ignores interaction effects, since calendar aging at high SOC and temperature also affects subsequent cycling, as a 2025 Journal of Materials Chemistry A study of LFP/graphite pouch cells found. Fade is also front-loaded (close to a square-root curve), so adding straight lines understates early-life loss and overstates late-life loss. It is a planning tool, not a prediction.
What fade costs in practice
Capacity loss shows up as shorter runtime. Scenario: a 1,000 Wh (nominal) LiFePO4 power station powering a 100 W AC load, using the site planning factor of 0.80 combined usable-energy fraction. Usable energy = nominal Wh × SOH × 0.80.
| SOH | Stored energy (Wh) | Usable at load (Wh) | Runtime at 100 W |
| 100% | 1,000 | 800 | 8.00 h |
| 90% | 900 | 720 | 7.20 h |
| 80% | 800 | 640 | 6.40 h |
| 70% | 700 | 560 | 5.60 h |
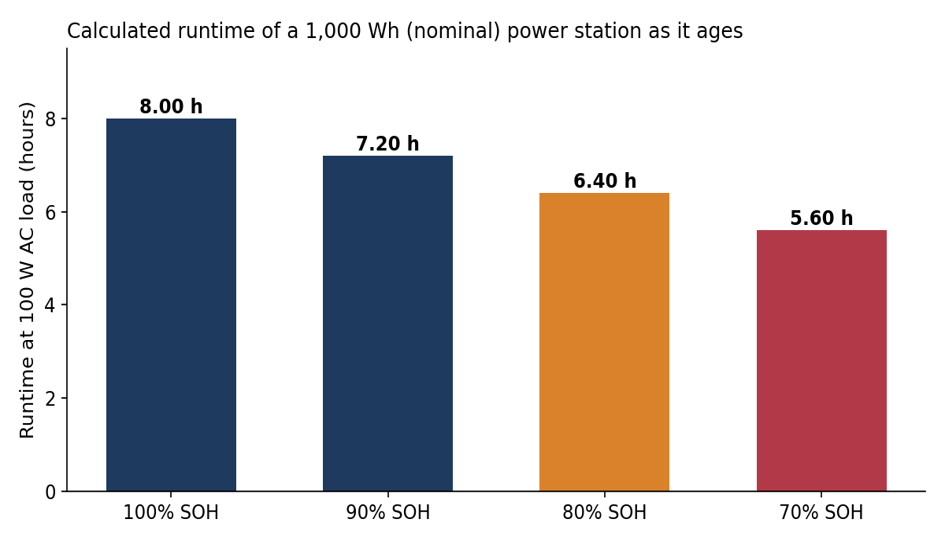
Figure 4. Calculated runtime versus state of health. Assumes constant 100 W load, 0.80 combined depth-of-discharge and inverter factor; real runtime varies with load behaviour and temperature.
A load that needs 6.5 hours of autonomy (650 Wh at the load) is met when the unit is new, at 8.00 hours, but falls short once SOH drops below about 81% (650 ÷ 800), so an installation sized with no margin fails quietly as soon as fade crosses that threshold. Sizing to end-of-life capacity, not nameplate, is the engineering answer. The runtime method is in how to calculate portable power station runtime and sizing in what size portable power station do I need.
What slows the loss, in order of evidence
- Keep cells cool. Temperature is the most consistently demonstrated driver in LFP calendar and cycling studies. Avoid closed hot enclosures, direct sun, and parked vehicles.
- Avoid long spells at 100% or at empty. Storage at moderate charge (40% to 60% for long idle periods, per manufacturer guidance) reduces calendar loss. Routine deep use is not the main concern.
- Use lower charging power when speed is not needed. Fast charging carries a measurable, though moderate, penalty in fleet data.
- For lead-acid, keep the bank fully recharged and cool. Sulfation follows undercharging, and each 8 °C of heat halves sealed-battery life.
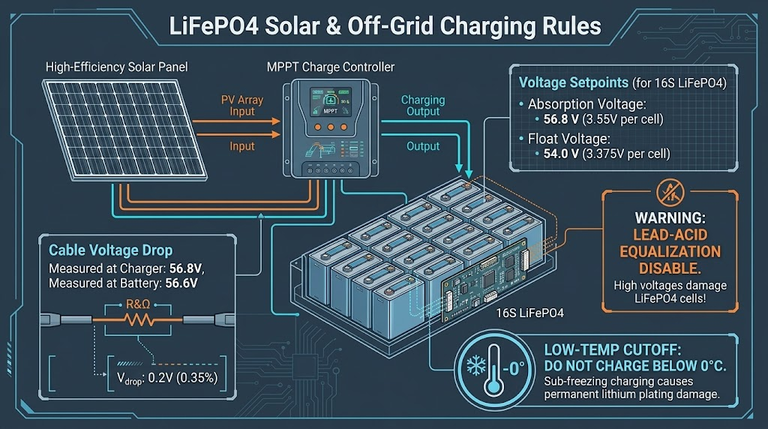
- Do not charge below freezing. Plating is irreversible and BMS charge-inhibit protections exist for this reason. Leave them enabled.
- Size with margin. Plan on 80% of nameplate energy at the end of the design life. See how to maintain a portable power station for routine care.
Common mistakes
- Judging health by cycle count alone. Cycles ignore the clock and the temperature. A lightly cycled battery kept hot and full can age faster than a heavily cycled one kept cool.
- Treating a cold-day runtime drop as permanent damage. Reduced output in cold weather is largely reversible; permanent loss shows up as a lower measured full-charge capacity at normal temperature.
- Confusing loss rate with service life. Ten degrees of heat raises the loss rate by about 50% for the LFP cells modelled, but roughly halves the life to a fixed loss. Both numbers are correct; they answer different questions.
- Applying lithium advice to lead-acid. Avoiding full charge protects lithium and harms lead-acid, which needs regular full recharging to avoid sulfation.
- Quoting a cycle rating without a test temperature. In the Wang model the same cell gives about 8,600 cycles to 80% at 25 °C and about 2,000 at 45 °C.
- Sizing to nameplate. A system that only just meets the load when new will not meet it after years of fade.
- Over-restricting the usable range. Limiting every charge to a narrow band costs runtime today for a benefit that fleet data suggests is small unless full or empty dwell is prolonged.
How to check the loss
Many power stations and battery management systems report SOH in an app; treat it as an estimate. A direct check is a controlled full-charge to cut-off discharge at a constant known load, measured in Wh at a stable room temperature, then compared with the rated figure. Use the unit’s own low-voltage cutoff, never a forced deep discharge, and do not open or modify a pack. For systems above extra-low voltage, testing belongs with a qualified installer.
Frequently asked questions
Does lost capacity come back?
Temporary components do: cold, high load, and state-of-charge estimation drift reverse. Loss of lithium inventory and active material does not. Battery University notes that a reduced peak-charge voltage lowers stored capacity, and applying the full peak voltage on a later charge restores it, which is a setting effect rather than aging.
Does a battery age if it is never used?
Yes. Calendar aging continues, and its rate depends on temperature and storage state of charge.
Is fade linear?
Not exactly. Laboratory studies often show early fade close to a square-root-of-time curve, other work reports linear fade at moderate temperatures, and the fleet averages quoted here are straight-line summaries. Late-life acceleration is possible, so end-of-life projections carry uncertainty.
Do lead-acid batteries age the same way?
No. Sulfation, grid corrosion, and undercharging dominate, and staying at full charge is protective. Heat still matters, with a guideline of life halving per 8 °C for sealed types.
Is 80% the point where a battery is finished?
No. It is the threshold used in cycle-life ratings. Whether a pack is still adequate depends on the load it must serve, as the runtime table above shows.
Conclusion
Batteries lose capacity because parasitic reactions steadily consume cyclable lithium and degrade the electrodes, and no operating habit stops that entirely. What can be controlled is the rate. Heat is the most consistently demonstrated accelerator, high state of charge over long periods adds to it, fast charging adds a moderate penalty, and cycling contributes in proportion to throughput. For rarely cycled backup batteries, calendar aging dominates; for daily-cycled solar storage, cycling does. Lead-acid banks add sulfation to the picture, and in warm Nigerian conditions a battery that sits a few degrees above the laboratory reference can lose a large share of its expected life.
The decision that follows is sizing: plan on roughly 80% of nameplate energy at end of life, and keep the pack cool. Next steps: work through how to calculate battery capacity in watt-hours, then read portable power station battery degradation for how these mechanisms show up in power stations.