
How to Calculate Portable Power Station Runtime
A 1000Wh power station and a 150W refrigerator produce a tempting piece of arithmetic: divide one number by the other and the answer looks like six and a half hours of backup. That number is usually wrong, sometimes by half, and the gap between the paper calculation and the real result is where most backup power planning goes off track.
The error is not in the division. It is in what gets divided. A power station’s advertised capacity is not the energy that reaches a connected appliance, a refrigerator’s rated wattage is not what it actually draws most of the time, and the inverter sitting between the battery and the wall outlet consumes part of every watt-hour that passes through it. Runtime calculated correctly accounts for all three.
The Quick Answer
The runtime of a portable power station under a steady load is:
Runtime (h) = Usable AC Energy (Wh) ÷ Load Power (W)
Usable AC Energy (Wh) = Nominal Capacity (Wh) × Derating Factor
For a LiFePO4 power station with a well-behaved battery management system and a typical modified pure sine inverter, a derating factor of about 0.80 is a reasonable planning figure. It combines roughly 95 percent usable depth of discharge with roughly 85 percent inverter efficiency (0.95 × 0.85 ≈ 0.80). This is the same derating factor used throughout the Sielectronix battery capacity guides, so a reader moving between articles is working from a consistent number rather than a different assumption on every page.
That figure is a planning estimate, not a guarantee. The sections below explain where it comes from and when it needs to be adjusted for a specific power station and a specific load.
Why the Simple Division Gets the Wrong Answer
Three separate losses sit between the number printed on a power station and the number of hours an appliance actually runs. Skipping any one of them produces an optimistic runtime that the battery cannot deliver.
Nominal Capacity Is Not Usable Capacity
A power station rated at 1000Wh does not release 1000Wh to a load before shutting down. Manufacturers reserve a margin at the bottom of the discharge curve to protect the cells and the electronics, and the battery management system enforces a cutoff before the pack reaches zero volts per cell.
This is a different failure mode from confusing power with energy in the first place, a distinction covered in more depth in Watts vs Watt-Hours: What Is the Difference?. The Wh rating on the box is an energy figure; how much of that energy the battery management system actually permits the reader to draw is the separate question addressed here.
Independent LiFePO4 cycle-life data compiled from Victron Energy’s published battery datasheets shows a clear trade-off between depth of discharge and cycle count: a cell rated for roughly 2,500 cycles at 80 percent depth of discharge reaches roughly 5,000 cycles at 50 percent depth of discharge (Victron Energy LiFePO4 datasheet discussion). Portable power station manufacturers pick a point on that curve, and most consumer units land near 90 to 100 percent usable depth of discharge because the battery management system is designed for a smaller number of total cycles than a stationary home battery. The practical effect is that nominal Wh and usable Wh are close for most portable units, but they are rarely identical.
Inverter Efficiency Removes Another Slice
Converting stored DC energy into household AC power is not free. A modern pure sine inverter in a well-built power station typically converts DC to AC at somewhere between 85 and 92 percent efficiency, with the number varying by load level and by design. EcoFlow’s published specifications for the DELTA 3 series list a 95 percent efficiency figure specifically for the unit’s DC Anderson output, which bypasses the inverter entirely. That distinction matters: DC-to-DC output on a power station is more efficient than DC-to-AC output through the inverter, because the inverter stage is where most of the conversion loss actually occurs.
Inverter efficiency is also not constant across the load range. Efficiency is usually lowest at very light loads, where the inverter’s own standby and switching losses are a larger fraction of the total power flowing through it, and it improves somewhat as load increases toward the unit’s rated output, then falls off again near the surge limit.
Idle and Standby Draw Keeps Consuming Energy
A power station with its inverter switched on consumes a small amount of power even with nothing plugged in, typically in the range of a few watts to about 15 watts depending on the model and whether Wi-Fi, a display, or cooling fans are active. For a light load such as a router or a CPAP machine, that standby draw is a meaningful fraction of total consumption and belongs in the calculation rather than being ignored.
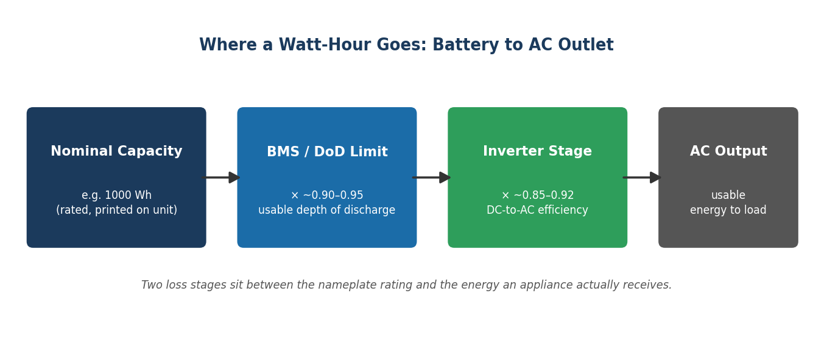
Figure 1. Two loss stages separate a power station’s nameplate Wh rating from the AC energy that actually reaches a connected appliance.
The Runtime Calculation Method, Step by Step
Step 1: Establish the Usable Energy
Start from the nominal Wh rating printed on the unit or listed in its specifications. Apply the derating factor appropriate to the unit’s chemistry and inverter design. In the absence of manufacturer-published usable capacity and inverter efficiency figures, 0.80 is a defensible planning value for a modern LiFePO4 unit. If the manufacturer publishes a usable-capacity figure directly, use that instead of the general estimate.
Step 2: Identify the Actual Load, Not the Rated Wattage
A device’s nameplate wattage is frequently a worst-case or startup figure, not what it consumes during normal operation. A laptop charger rated at 65W typically draws less once the battery is topped off. A refrigerator’s compressor label describes the wattage while the compressor is running, not the average power over a full day that includes idle periods between cycles. Runtime calculations need average sustained power, not the highest number on the label.
Step 3: Apply Inverter Losses if the Load Runs on AC
If the load is connected to a DC output such as a USB port, a 12V car-style socket, or an Anderson port, inverter losses generally do not apply because the power never passes through the inverter stage. If the load is plugged into the AC outlet, the derating factor already applied in Step 1 accounts for that conversion loss, so it should not be subtracted a second time.
Step 4: Add Standby Draw for Long-Duration, Low-Power Loads
For loads under roughly 50W, add an estimated 5 to 15W of continuous standby consumption to the load figure before dividing. For loads above a few hundred watts, standby draw is small enough relative to the load that it can usually be ignored without materially changing the result.
Step 5: Calculate Runtime
Runtime (h) = Usable AC Energy (Wh) ÷ (Load Power (W) + Standby Draw (W))
The result is an estimate, not a guarantee. Battery aging, cold temperature, and load variability all move the actual result away from the calculated one, usually downward. That is addressed later in this article.
Worked Examples
The three cases below use the 0.80 derating factor established above. Each is a realistic but illustrative scenario, not a measurement of a specific product.
Case 1: A CPAP Machine on a Small Power Station
A CPAP machine with humidifier draws an average of about 30W during normal use, connected to a 300Wh power station.
Usable AC energy = 300 Wh × 0.80 = 240 Wh
Runtime = 240 Wh ÷ 30 W = 8.0 hours
Eight hours covers a full night for most sleepers, but a machine with a heated hose or a higher humidifier setting can draw closer to 40 to 45W, which brings the same power station down to roughly 5.3 to 6.0 hours. The device’s actual average draw, not its maximum rated draw, is what determines whether a given capacity is adequate.
Case 2: A Home Office Load on a Mid-Size Power Station
A laptop (65W), an external monitor (35W), and a Wi-Fi router (10W) run simultaneously from a 1000Wh power station, a combined continuous load of 110W.
Usable AC energy = 1000 Wh × 0.80 = 800 Wh
Runtime = 800 Wh ÷ 110 W ≈ 7.3 hours
That is close to a full workday, but the estimate assumes the laptop stays plugged in and charging rather than idling on battery, and it does not include periodic device charging (a phone, tablet, or headset) that a home office would realistically add over the course of the day.
Case 3: A Compressor Refrigerator, Where Duty Cycle Rewrites the Math
A compact refrigerator with a compressor rated at 150W running wattage does not run continuously. A well-insulated unit in a moderate ambient temperature typically cycles the compressor on for roughly 35 to 40 percent of each hour and sits at a low idle draw of about 3 to 5W the rest of the time. Using the 150W rated figure as a continuous load, the way a simple online calculator often does, overstates consumption by roughly a factor of two to three.
Average power ≈ (150 W × 0.38) + (4 W × 0.62) ≈ 60.5 W
Usable AC energy (2000 Wh unit) = 2000 Wh × 0.80 = 1600 Wh
Runtime ≈ 1600 Wh ÷ 60.5 W ≈ 26.4 hours
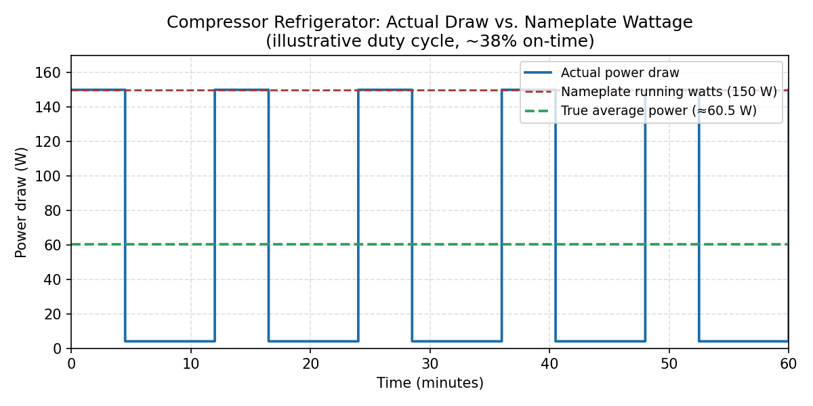
Figure 2. Illustrative compressor duty cycle: the appliance draws its full 150W rating only about 38 percent of the time, so the average power used in the runtime formula is far below the nameplate figure.
Using the nameplate 150W as a continuous load instead would produce an estimate of about 10.7 hours on the same power station, a difference of more than 15 hours from a single wrong assumption about duty cycle. Compressor cycling is the single most common source of badly wrong runtime estimates for refrigeration loads, and it is explained in more detail in the following section.
Estimated Runtime by Capacity and Load
The table and chart below apply the calculation method above across a range of common capacities and continuous loads. Values are calculated, not measured, and use the 0.80 derating factor described earlier.
| Nominal Capacity | 10W (router) | 50W (laptop) | 100W (mixed devices) | 200W (small fridge, avg.) |
| 256 Wh | 20.5 h | 4.1 h | 2.0 h | 1.0 h |
| 500 Wh | 40.0 h | 8.0 h | 4.0 h | 2.0 h |
| 1000 Wh | 80.0 h | 16.0 h | 8.0 h | 4.0 h |
| 2000 Wh | 160.0 h | 32.0 h | 16.0 h | 8.0 h |
Table 1. Calculated runtime by nominal capacity and continuous load, using a 0.80 usable-energy factor. Illustrative estimate, not a measured result for any specific product.
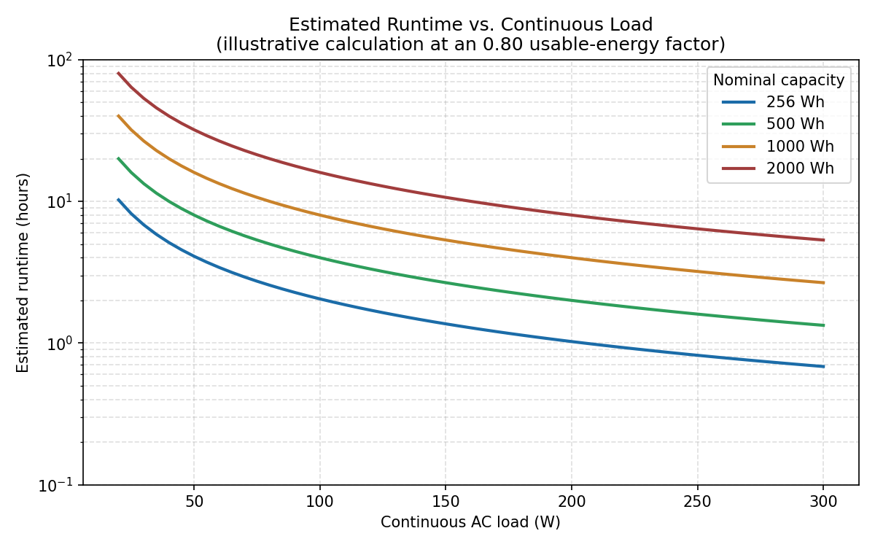
Figure 3. Estimated runtime versus continuous AC load for four common power station capacities, calculated at a 0.80 usable-energy factor. Log scale on the vertical axis.
Why Compressor-Driven Appliances Break the Simple Formula
Runtime formulas assume a steady, continuous load. Most refrigerators, freezers, and some window air conditioners do not present a steady load; the compressor cycles on and off to hold a setpoint temperature, and the fraction of time it spends running (its duty cycle) depends on ambient temperature, insulation quality, thermostat setting, and how often the door opens.
The correct way to size or estimate runtime for a compressor appliance is to use its average daily energy consumption, usually expressed in kWh per day on an Energy Guide label or in manufacturer documentation, rather than its running wattage. Dividing daily kWh by 24 gives an average power figure that already accounts for duty cycle, and that average power is what belongs in the runtime formula, not the compressor’s peak running wattage.
Ignoring duty cycle is one of the most common and most consequential mistakes in portable power station runtime planning, precisely because refrigeration is one of the most common reasons people buy a power station in the first place.
Common Mistakes That Distort Runtime Estimates
Using Rated or Surge Wattage Instead of Actual Draw
A device’s nameplate or surge rating describes a worst case, not typical operation. Using it as a continuous load figure produces a runtime estimate that is conservative in the wrong direction for planning purposes: it understates how long the power station will actually last, which is a safer error than the reverse, but it is still not an accurate estimate.
Treating Nominal Wh as Usable Wh
Skipping the derating step and dividing the full nameplate capacity by the load produces a runtime figure that the power station’s own battery management system will not allow it to deliver, since the BMS cuts off discharge before the cells are fully depleted. Anern’s technical guidance on LiFePO4 usable capacity walks through the same usable-energy formula used in this article: usable energy equals nominal capacity multiplied by voltage and depth of discharge, not nominal capacity alone.
Ignoring the Inverter Stage Entirely
Runtime estimates that skip inverter losses altogether are consistently optimistic for any AC-powered load. The loss is not negligible: at 85 percent inverter efficiency, roughly 15 percent of every watt-hour drawn from the battery never reaches the appliance.
Assuming Constant Power for a Cycling Appliance
As shown in Case 3 above, using a compressor’s running wattage as a continuous load can overstate consumption by a factor of two or more. Average daily energy consumption, not peak running wattage, is the correct input for any appliance that cycles on and off.
Forgetting That Battery Age and Temperature Change the Result
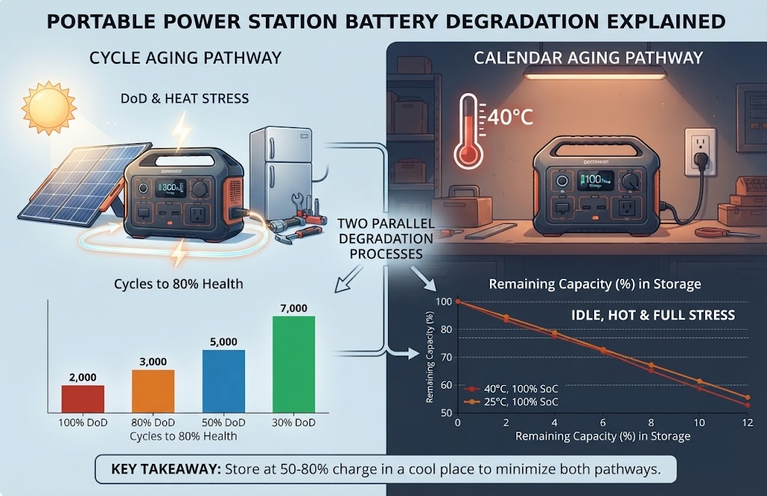
A LiFePO4 pack that has completed several hundred cycles typically retains somewhat less than its original capacity, and cold ambient temperature reduces both usable capacity and inverter efficiency. A runtime calculation performed on day one with a new battery at room temperature will not match the same calculation three years later during a winter outage. Neither of these effects can be predicted precisely without manufacturer aging data for the specific unit, but both push the real result below the fresh-battery estimate, which is a reason to treat the 0.80 factor as a planning baseline rather than a ceiling.
How Runtime Relates to Sizing a Power Station
Runtime calculation and capacity sizing are two sides of the same formula, solved for different variables. A reader who already knows the required backup duration and the load should size backward from that target using the method in How to Calculate the Battery Capacity for Portable Power Station, which walks through the same usable-energy and inverter-efficiency factors from the opposite direction. A reader starting from a specific product’s Wh rating and wanting to know what it can support should also see What Size Portable Power Station Do I Need? for a full sizing methodology, a worked 24-hour outage scenario, and a reference table of common appliance wattages.
Frequently Asked Questions
Does a bigger inverter make runtime longer?
No. Inverter size (its maximum continuous output rating) determines what the power station can run, not how long it can run it. A larger inverter connected to the same battery capacity and the same load produces the same runtime; inverter rating and battery capacity are independent specifications that answer different questions.
Will solar charging extend runtime during an outage?
Yes, but only during the hours solar input is actually available and only up to the panel’s rated output. Solar input does not extend runtime at night or on a heavily overcast day. A runtime calculation for an outage that includes daytime solar charging should treat solar as a partial daily energy input added to the starting capacity, not as a continuous addition to load capacity.
Is manufacturer-advertised runtime accurate?
Manufacturer runtime claims are usually calculated the same way described in this article, applied to a specific test load, and they are generally directionally reasonable. They should still be treated as an estimate rather than a guarantee, since ambient temperature, battery age, and the difference between the test load and an actual household load all affect the real result.
Does running a power station down to zero percent damage it?
Most portable power stations with LiFePO4 chemistry and a competent battery management system will cut off discharge automatically before the cells reach a damaging voltage, so an indicated 0 percent generally reflects the BMS cutoff rather than true cell depletion. Victron Energy’s LiFePO4 cycle-life documentation indicates that occasional deep discharge does not meaningfully harm the cells, though routinely discharging to the BMS cutoff on every cycle reduces total cycle life compared with a shallower routine discharge.
Conclusion
Portable power station runtime is not the nameplate Wh divided by the appliance’s rated wattage. It is the usable energy, after accounting for depth of discharge and inverter efficiency, divided by the load the appliance actually draws on average, including standby consumption for light loads and duty cycle for anything with a compressor. The single most common error is using peak or rated wattage instead of average draw, and for refrigeration loads in particular that error can overstate real consumption by a factor of two or more.
A 0.80 usable-energy factor is a reasonable starting point for a modern LiFePO4 power station in the absence of manufacturer-published figures, but it is a planning baseline, not a fixed constant. Battery age, ambient temperature, and load variability all move the real-world result below a fresh-battery calculation, which is a reason to size with margin rather than to the calculated minimum.
Before relying on a runtime estimate for a real outage, calculate both the average load and the total required capacity separately using the method in How to Calculate the Battery Capacity for Portable Power Station, rather than working from a single rated-wattage figure.
Sources
Technical assumptions used in this article, including inverter efficiency ranges and LiFePO4 depth of discharge guidance, were checked against the following published sources:
1. EcoFlow, “DELTA Series portable power station specifications” (manufacturer-published DC output efficiency and AC continuous/surge output ratings).
2. Victron Energy, “Official Depth of Discharge Recommendations for LiFePO4” (cycle life versus depth of discharge, sourced from Victron’s published cell datasheet).
3. Anern, “LiFePO4 DoD Guide: Maximize Usable Battery Capacity” (usable energy formula and manufacturer-cited recommended depth of discharge for LiFePO4 cells).
Appliance wattage and duty-cycle figures used in the worked examples are general reference estimates for illustration. Actual values vary by model and should be confirmed against the specific device’s nameplate rating or manufacturer documentation before use in a real sizing decision.
[…] Sizing to end-of-life capacity, not nameplate, is the engineering answer. The runtime method is in how to calculate portable power station runtime and sizing in what size portable power station do I […]