
Portable Power Station Battery Degradation Explained
Quick Answer
Every portable power station battery loses capacity over time through two separate processes: cycle aging (wear from repeated charge and discharge) and calendar aging (chemical decay that happens even while the battery sits idle). A LiFePO4 (LFP) power station used once a day and rated for 3,000 cycles to 80% capacity will typically still hold about 80% of its original energy after roughly 8 to 10 years of daily use. Temperature and storage state of charge affect the calendar side independently of how often the unit is actually used, which is why two identical power stations can age at very different rates depending on how they are stored.
What Battery Degradation Actually Means
Degradation is not a single number. Manufacturers describe it primarily through two measurable changes in the battery pack.
Capacity fade is the loss of usable energy storage. A power station rated at 1,000Wh new might only hold 800Wh after enough cycles or enough time, even though it charges to what the display calls 100 percent.
Internal resistance rise is a separate effect where the cell’s ability to deliver current efficiently declines. This shows up as more heat during high loads, a lower usable voltage under load, and reduced peak or surge output, sometimes before capacity fade becomes noticeable.
Both processes are driven by the same underlying chemistry: as a lithium-ion or lithium iron phosphate (LiFePO4) cell ages, a layer called the solid electrolyte interphase (SEI) grows on the anode. This layer consumes cyclable lithium and adds resistance. SEI growth accelerates with heat and with high state of charge, which is why temperature and storage habits matter as much as how often the unit is used (Journal of The Electrochemical Society, NREL-supported LFP aging study).
Two Separate Aging Mechanisms
Cycle life specifications on a spec sheet describe only part of the picture. A power station ages from two mechanisms that run in parallel, not in sequence, and either one can dominate depending on how the unit is actually used.
Cycle Aging: Wear From Use
Cycle aging accumulates every time the battery is charged and discharged. Manufacturers rate cycle life to a specific endpoint, almost always 80 percent of original capacity, because that threshold represents a meaningful and measurable point of decline rather than the point the battery stops working.
Three variables drive how fast cycle aging accumulates:
- Depth of discharge (DoD): a full 0 to 100 percent cycle stresses the cell far more than a shallow 40 to 60 percent cycle. Manufacturers rate cycle life at a specific DoD, usually 80 to 100 percent, and shallower daily use extends real-world cycle count substantially.
- C-rate (charge and discharge speed): faster charging and heavier loads increase internal heat and mechanical stress on the electrode structure, accelerating wear per cycle.
- Temperature during cycling: cycling at high temperature compounds the damage from DoD and C-rate rather than acting independently.

Figure 1. Shallower discharges add far more usable life to a LiFePO4 pack than deep, full cycles.
Calendar Aging: Wear From Time
Calendar aging happens even if the power station never gets used. It is driven primarily by two factors: storage temperature and the state of charge the battery is left at. Research modeling LiFePO4 calendar aging found that capacity loss accelerates through side reactions at the electrode-electrolyte interface, and that both higher temperature and higher resting state of charge independently speed up SEI growth (integrated storage-degradation study on LiFePO4 cells).
One electrochemical-thermal aging model illustrates how much these two variables matter together: cells held at 25°C and 100% state of charge dropped below 80% state of health in about 5 months of pure storage, while identical cells at 40°C and 100% state of charge crossed that threshold in just over 2 months. Cells held at 10°C and 30% state of charge retained 93% capacity after a full 12 months (coupled calendar and cycle aging model). None of those cells were cycled at all. The loss came entirely from sitting in storage.

Figure 2. Illustrative trend lines shaped from published lithium-ion calendar aging research. Storing a unit hot and full is the single fastest way to lose capacity without ever using it.
LiFePO4 vs NMC/Li-ion: Why Chemistry Changes the Numbers

Most modern portable power stations use one of two lithium chemistries, and the choice has a large effect on how fast the unit degrades.
| Chemistry | Typical cycle life (to 80%) | Approx. years, daily use | Thermal stability |
| LiFePO4 (LFP) | 3,000 to 6,500 cycles | 8 to 15 years | Excellent |
| NMC / Li-ion | 500 to 1,000 cycles | 2 to 5 years | Moderate |
EcoFlow’s published specifications for its LFP battery packs list 3,000 cycles to 80 percent capacity for its standard packs and up to 3,500 for higher-current variants, which is representative of the LiFePO4 class used across most current-generation power stations. NMC packs, still common in older or lighter-weight units, are rated closer to 500 to 1,000 cycles for the same 80 percent endpoint.
The practical consequence is straightforward: a household using an LFP power station daily for home office backup or refrigerator support can reasonably expect a decade or more of service before capacity drops meaningfully. The same daily-use pattern on an older NMC unit could show noticeable capacity loss within three to four years.
Worked Example: Estimating Remaining Capacity
Cycle life specifications can be converted into a rough capacity forecast using a simple linear approximation, which is conservative enough for planning purposes even though real degradation curves are not perfectly linear.
Scenario:
- Power station: 1,024Wh rated capacity, LiFePO4
- Manufacturer rating: 3,000 cycles to 80% capacity
- Usage pattern: one full-equivalent cycle every 2 days (a mix of partial and full discharges totaling roughly one full cycle every 48 hours)
Step 1: Estimate cycles accumulated per year.
365 days / 2 days per cycle ≈ 183 cycles per year.
Step 2: Estimate years to reach the rated cycle count.
3,000 cycles / 183 cycles per year ≈ 16.4 years to reach the 3,000-cycle, 80%-capacity point.
Step 3: Interpolate an earlier estimate, for example at year 5.
5 years × 183 cycles/year = 915 cycles ≈ 30.5% of rated cycle life used. Applying that fraction linearly against the 20-percentage-point total loss expected by 3,000 cycles gives an estimated capacity loss of about 6 percentage points from cycling alone, or roughly 94% of original capacity remaining from cycling stress.
This estimate covers cycle aging only. If the unit also spends long periods stored hot and fully charged, calendar aging adds further loss on top of this figure, which is why two units with identical cycle counts can show different real-world capacity after the same number of years.
For calculating how usable capacity translates into actual appliance runtime today, see the site’s runtime calculation guide, which applies the standard usable-energy derating factor for inverter and depth-of-discharge losses.
Why Shallow Cycles Add Up to More Total Lifetime Energy
The DoD relationship in Figure 1 looks counterintuitive at first: a battery cycled shallowly delivers more total cycles, but each cycle moves less energy. The number that actually matters for comparing usage patterns is total lifetime throughput, the cumulative watt-hours the battery delivers before reaching 80% capacity, not the raw cycle count.
Using the same 1,024Wh LiFePO4 pack and the cycle-life-by-DoD figures from Figure 1:
| Discharge pattern | Rated cycles to 80% | Energy per cycle | Total lifetime throughput |
| 100% DoD every time | 2,000 | 1,024Wh | ≈ 2,048,000Wh |
| 80% DoD every time | 3,000 | 819Wh | ≈ 2,457,000Wh |
| 50% DoD every time | 5,000 | 512Wh | ≈ 2,560,000Wh |
| 30% DoD every time | 7,000 | 307Wh | ≈ 2,149,000Wh |
The 50 percent DoD pattern delivers the most total energy over the battery’s life, not the shallowest or the deepest option. This is the practical reason partial-cycle habits, charging back up from 40 to 50 percent rather than always running to empty, extend real-world service life: the battery is not just surviving longer in cycle count, it is delivering more usable energy in total before crossing the 80 percent threshold.
Three Real-World Usage Profiles Compared
Cycle-life specifications describe laboratory conditions. Actual degradation timelines depend heavily on which of three common usage patterns a power station falls into, and off-grid solar users, campers, and emergency-backup owners tend to land in genuinely different places on the aging curve.
| Usage profile | Typical cycling | Dominant aging mechanism | Realistic years to 80% (LiFePO4, 3,000-cycle spec) |
| Off-grid solar, daily cycling | One near-full cycle per day, year-round, moderate DoD | Cycle aging, moderate temperature exposure from outdoor enclosures | 7 to 9 years |
| Weekend or seasonal camping | 10 to 30 cycles per year, shallow DoD | Calendar aging dominates; cycle count is nearly irrelevant | 10 to 15 years, if stored correctly between trips |
| Emergency standby backup | Near-zero cycling, held at high charge on trickle/pass-through | Calendar aging almost entirely, driven by resting SoC and ambient heat | 5 to 10 years, heavily dependent on charge limit settings |
The off-grid solar case is the one scenario where cycle aging genuinely dominates, since the battery is charged and substantially discharged on a near-daily basis for years. This is also the scenario where the DoD-management principle above matters most in practice: an off-grid system sized so the battery routinely runs a 40 to 70 percent daily swing, rather than 0 to 100 percent, will meaningfully outlast one that is drained close to empty every night before the next solar charge cycle begins. For sizing the battery correctly against a daily load in the first place, see the site’s battery capacity guide for portable power stations.
The emergency-standby case is the counterintuitive one. These units are cycled the least but can age fastest if left at 100 percent on permanent pass-through power without a charge limit, since resting state of charge, not cycle count, is what drives their degradation. A unit used twice a year for actual outages but left plugged in at full charge the rest of the time can lose more capacity over five years than a camping unit cycled 20 times a year and stored properly in between.
What Accelerates Degradation
Several common habits shorten battery life faster than normal use alone would predict.
- Storing at 100% charge for extended periods. Full charge holds the cathode at its highest voltage, which is the condition that most accelerates SEI growth during calendar aging.
- Storing or operating in high heat. Every roughly 10°C increase in average temperature approximately doubles the rate of calendar-driven capacity loss, a widely cited rule of thumb consistent with the Arrhenius-based aging models used in the NREL research above.
- Frequent deep discharges to near 0%. Full discharge cycles are rated lower on the DoD curve shown in Figure 1 than partial cycles of the same total energy throughput.
- Leaving the unit on trickle or pass-through charge at 100% indefinitely, common when a power station is used as a permanent UPS-style backup without a charge limit set.
- High-current fast charging on every cycle, which raises internal heat and adds cycle-aging stress beyond what the DoD alone would predict.
How to Slow Degradation
Manufacturer maintenance guidance across major brands converges on a consistent set of practices, all grounded in the calendar-aging and cycle-aging mechanisms above.
| Practice | Why it works | Practical target |
| Store at partial charge, not full | Reduces cathode voltage stress during idle time | 50% to 80% state of charge |
| Keep storage cool | Slows the Arrhenius-driven chemical side reactions | 15–23°C (59–73°F) |
| Avoid habitual deep discharges | Shallower DoD cycles fall higher on the cycle-life curve | Recharge before dropping below ~20% |
| Set a charge limit if available | Prevents prolonged full-charge dwell time in pass-through use | 80% cap for standby/backup duty |
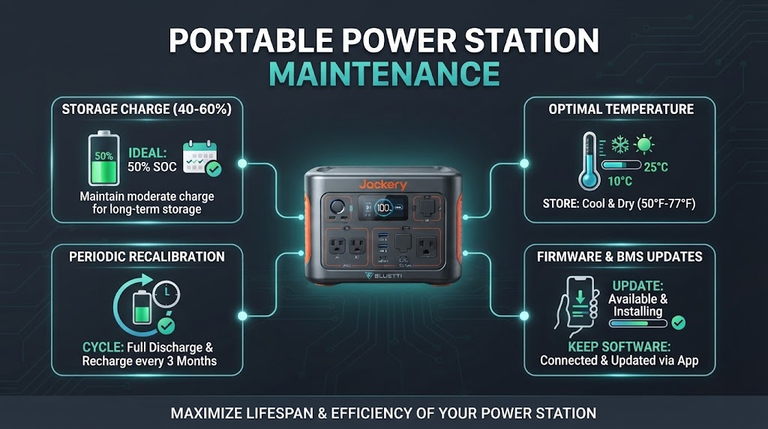
| Check and top up idle units periodically | Prevents BMS-driven self-discharge from reaching unsafe low voltage | Every 3 months if unused |
Most manufacturer guidance, including EcoFlow, Jackery, and Bluetti maintenance documentation, recommends the 50 to 80 percent storage range for units that will sit unused for more than a month, with 60 percent commonly cited as a practical middle point that balances self-discharge buffer against voltage stress.
Warranty Length as an Indirect Signal
Warranty terms are not a degradation measurement, but they are one of the few places a manufacturer puts financial weight behind a cycle-life claim, and current published warranty terms broadly track cycle rating within each brand’s own lineup. Bluetti’s higher-capacity LiFePO4 models are commonly listed at 4 to 5 years standard coverage, while EcoFlow and several other LiFePO4-based brands list similar ranges; older lithium-ion or lower-tier models within the same brand lineups are frequently listed at shorter terms of 2 to 3 years.
Treat warranty length as a rough cross-check against a stated cycle rating rather than a standalone longevity metric: warranty terms vary by brand, region, and specific model far too much to compare precisely across manufacturers, and a longer warranty on its own does not guarantee a longer real-world service life.
Recognizing Degradation
Degradation is gradual and usually shows up as a pattern rather than a sudden failure. Typical signs include:
- Runtime for the same appliance load noticeably shorter than it was a year or two earlier, after accounting for any change in the load itself.
- The unit reaching 100% on the display faster than before, or dropping from 100% more quickly under the same load.
- Increased heat or fan activity at the same output power that previously ran cooler.
- Reduced surge or peak output capability, since rising internal resistance affects high-current delivery before it affects total stored energy.
None of these signs mean the unit has failed. A pack at 80% of rated capacity is functioning exactly as its cycle-life specification predicted, and most units remain safely usable well past that threshold, just with reduced total energy and, eventually, reduced peak output.
One sign that does warrant attention rather than routine expectation: visible case swelling, a battery compartment that feels warm at rest with no load connected, or a burning or chemical odor. These are not normal degradation symptoms and indicate the pack should be taken out of service and the manufacturer contacted, since they can precede thermal events in any lithium chemistry, though LiFePO4 is substantially more thermally stable than NMC or older lithium-ion cells under these conditions.
When to Replace vs Keep Using a Degraded Unit

A power station at 80 percent capacity is not a unit that needs replacing. The decision point is really about whether remaining capacity still meets the load it needs to serve, not the percentage figure itself.
- If the unit still comfortably covers its intended load (a specific appliance, a specific trip length, a specific outage duration), continued use at reduced capacity is normal and expected. Recalculate remaining runtime against current appliances using the same method as the worked example above, substituting the estimated remaining capacity for the original rated figure.
- If peak or surge output has declined enough that the unit now struggles to start motor-driven loads such as a refrigerator compressor or a well pump, that points to internal resistance rise rather than pure capacity fade, and is a stronger signal to consider replacement even if total Wh capacity still looks adequate.
- If the unit shows the swelling or heat signs above, replacement is a safety decision, not a capacity decision, regardless of remaining rated energy.
- For most non-removable-battery power stations, the battery pack is not independently replaceable, so unit replacement is the only option once capacity or safety no longer meets requirements. A small number of models, generally identified in their own product documentation, support swappable battery packs.
Common Misconceptions
“A cycle-life rating means the battery dies after that many charges.” It does not. The rating marks the point capacity is expected to fall to roughly 80 percent, not the point the battery stops functioning. Most units continue operating well beyond their rated cycle count, just with reduced capacity.
“Keeping it plugged in all the time is fine because the BMS protects it.” A battery management system prevents overcharging in the sense of exceeding safe voltage, but it does not prevent the calendar aging that comes from sitting at high voltage for long periods. Protection from damage is not the same as protection from gradual capacity fade.
“Lithium batteries need to be fully discharged before recharging.” This applies to older nickel-based chemistries, not lithium-ion or LiFePO4. Partial cycles are gentler on lithium chemistries than full discharges, which is the opposite of the old advice for nickel-cadmium batteries.
Frequently Asked Questions
Does fast charging damage a portable power station’s battery?
Fast charging adds more cycle-aging stress per charge than slow charging, mainly through added heat, but the effect is generally modest for occasional use. Charging quickly every single time, especially in warm ambient conditions, compounds that stress faster than mixing fast charging with normal-speed charging.
Will a portable power station battery eventually stop holding any charge?
Eventually, yes, but the decline is gradual. Capacity fade continues past the 80 percent rating point, and most batteries keep functioning, at reduced capacity, for a long time after that threshold. Internal resistance rise typically becomes the more limiting factor for heavy loads before total capacity loss makes the unit unusable.
Is LiFePO4 always better than NMC for longevity?
For cycle life and thermal stability, yes, LiFePO4 consistently outperforms NMC by a wide margin, as shown in the comparison table above. NMC still has advantages in energy density and weight per watt-hour, which is why some ultra-portable units still use it despite the shorter rated cycle life. See the site’s guide to how portable power stations work for how battery chemistry fits into the overall system.
Can degraded capacity be restored?
No. Capacity fade from SEI growth and lithium inventory loss is not reversible through any charging technique, calibration cycle, or software reset. A full discharge-charge calibration cycle can correct the battery management system’s percentage reading if it has drifted, but it does not restore lost physical capacity.
Does solar charging degrade the battery differently than wall (AC) charging?
The charge source itself, solar panel versus AC wall input, does not change degradation directly. What matters is the resulting charge current and the resulting resting state of charge. A solar setup that trickles the battery up slowly over a full day and is used daily, the typical off-grid pattern, tends to be gentler than repeated fast AC top-ups at high current. Where solar charging can accelerate aging is indirectly: outdoor installations often run hotter, and unregulated systems can leave the battery sitting at 100 percent for long stretches between loads, both of which are calendar-aging accelerants covered above rather than effects specific to the charge source.
Why do two power stations with similar specs sometimes have very different real-world lifespans?
Published cycle-life numbers describe controlled laboratory conditions, typically a fixed temperature, a fixed DoD, and a fixed charge rate. Real ownership rarely matches those conditions exactly. Two units with identical 3,000-cycle LiFePO4 specifications can diverge significantly in practice if one spends its life in a cool garage cycled at 50 percent DoD and the other spends its life in a hot vehicle trunk held at 100 percent between uses. The specification describes the cell’s potential under test conditions; storage and operating conditions determine how closely real-world performance tracks that number.
Conclusion
Portable power station batteries age through two mechanisms that operate independently: wear from actual use and chemical decay from time spent in storage, with temperature and resting state of charge as the dominant calendar-aging variables. LiFePO4 chemistry, now standard in most current-generation units, offers a meaningful longevity advantage over older NMC packs, typically lasting 8 to 15 years under daily use compared to 2 to 5 years for NMC.
Which mechanism matters most depends heavily on the usage profile: daily off-grid solar cycling puts cycle aging in the driver’s seat, while camping and emergency-standby units age mostly from how, and at what charge level, they sit in storage. The single most effective habit for extending real-world battery life across all three profiles is storing the unit at a partial charge, roughly 50 to 80 percent, in a cool location, rather than leaving it full and hot between uses.
For sizing a new purchase around expected years of service, see what size portable power station do I need, and for understanding how rated capacity translates into watt-hours in the first place, see watts vs watt-hours explained.

[…] This guide separates the chemistry from the folklore. It explains what is physically lost, why time alone ages a battery, how much heat really accelerates the process (with a calculation that corrects a common rule of thumb), and how calendar aging and cycling trade places depending on how a battery is used. Lead-acid batteries, which still turn up in many backup installations and fail in different ways, get their own section, followed by what the temperature record implies for Nigerian conditions. For the cycle-count view of the same subject, see battery cycle life explained; for a power-station-specific look at wear, see portable power station battery degradation. […]