Battery C-Rate Explained
Quick Answer
C-rate is a battery’s charge or discharge current expressed as a multiple of its rated capacity. A 1C rate draws or delivers a current numerically equal to the battery’s Ah rating and empties or fills it in about one hour. 0.5C takes about two hours, 2C takes about thirty minutes. The formula is C-rate = Current (A) / Capacity (Ah), which can be rearranged to Current (A) = C-rate x Capacity (Ah).
A 100Ah LiFePO4 battery charging at 0.2C draws 20A; the same battery discharging at 1C draws 100A. Staying within the manufacturer’s rated charge and discharge C-rate protects capacity, cycle life, and safety margins. Most LiFePO4 packs used in home backup and portable power stations are built around a recommended charge rate of 0.2C to 0.5C and a maximum continuous discharge of 0.5C to 1C, though the exact figures always come from the cell manufacturer’s datasheet or the battery management system (BMS) configuration, not a universal rule.
What C-Rate Actually Means
Every rechargeable battery has a capacity rating in ampere-hours (Ah), the amount of current it can theoretically supply for one hour. C-rate takes that number and turns it into a speed measurement. It answers a single practical question: at this current, how many hours will it take to fully charge or discharge the battery?
According to Battery University, the C-rate specifies the speed at which a battery is charged or discharged. At 1C, the applied current is numerically equal to the battery’s marked Ah rating. At 0.5C, the current is half that value and the time doubles. At 0.1C, the current is one-tenth and the time stretches to roughly ten hours.
C-rate is written two ways that mean the same thing. A rate can be shown as a decimal multiple, such as 0.2C or 2C, or as a fraction, such as C/5 (equivalent to 0.2C) or C/2 (equivalent to 0.5C). Both notations describe the same current relative to capacity.
This normalization is what makes C-rate useful. A 5A discharge current means very different things on a 10Ah battery and a 300Ah battery. Expressed as a C-rate, a 5A draw is 0.5C on the small battery and roughly 0.017C on the large one, which immediately communicates how hard each battery is actually working, independent of its physical size.
The C-Rate Formula and How to Calculate It
The relationship between current, capacity, and C-rate is a simple, direct proportion:
C-rate = Current (A) / Rated Capacity (Ah)
Rearranged for the two other common uses:
- Current (A) = C-rate x Rated Capacity (Ah)
- Time to full charge/discharge (h) = 1 / C-rate
Worked Example 1: Finding the C-Rate From a Known Current
A 100Ah LiFePO4 battery, the size used in 100Ah lithium battery home backup systems, is charged from a solar array delivering 39A.
- Known values: Current = 39A, Capacity = 100Ah
- C-rate = 39A / 100Ah = 0.39C
- Interpretation: this sits inside the 0.2C to 0.5C range most LiFePO4 manufacturers recommend for daily charging, and it would fill an empty battery in roughly 2.6 hours under ideal conditions.
Worked Example 2: Finding the Current From a Target C-Rate
The same 100Ah battery needs to discharge at its manufacturer-rated maximum continuous rate of 0.5C.
- Known values: C-rate = 0.5C, Capacity = 100Ah
- Current = 0.5 x 100Ah = 50A
- Interpretation: the load connected to this battery should not continuously draw more than 50A, which at a nominal 12.8V corresponds to roughly 640W of continuous DC load before inverter losses.
C-Rate Reference Table: Time to Charge or Discharge
Because C-rate and time are reciprocals of each other, every C-rate value maps to a fixed theoretical charge or discharge duration. This holds regardless of the battery’s physical size, which is exactly why C-rate is used instead of raw current when comparing batteries.
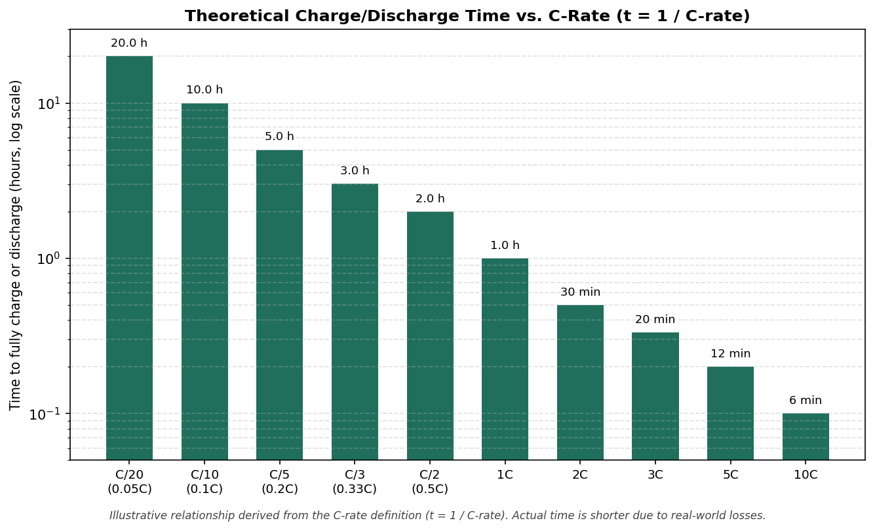
Figure 1. Theoretical charge/discharge time at common C-rates, calculated directly from t = 1 / C-rate. Real-world time is shorter than this because of resistive and conversion losses discussed later in this article.
| C-Rate | Notation | Theoretical Time | Typical Use |
| 0.05C | C/20 | 20 hours | Historic lead-acid rated-capacity test |
| 0.1C | C/10 | 10 hours | Gentle overnight charging, standby float |
| 0.2C | C/5 | 5 hours | Standard LiFePO4 datasheet capacity rating |
| 0.33C | C/3 | 3 hours | Moderate solar charging current |
| 0.5C | C/2 | 2 hours | Common LiFePO4 max recommended rate |
| 1C | 1C | 1 hour | Common LiFePO4 max continuous discharge |
| 2C | 2C | 30 minutes | High-drain power tools, some NMC packs |
| 3C | 3C | 20 minutes | Prismatic LiFePO4 upper limit (select packs) |
| 5C | 5C | 12 minutes | High-power NMC/NCA cylindrical cells |
| 10C | 10C | 6 minutes | Specialized high-rate 18650 cells |
Current Draw at Different C-Rates for Common Battery Sizes
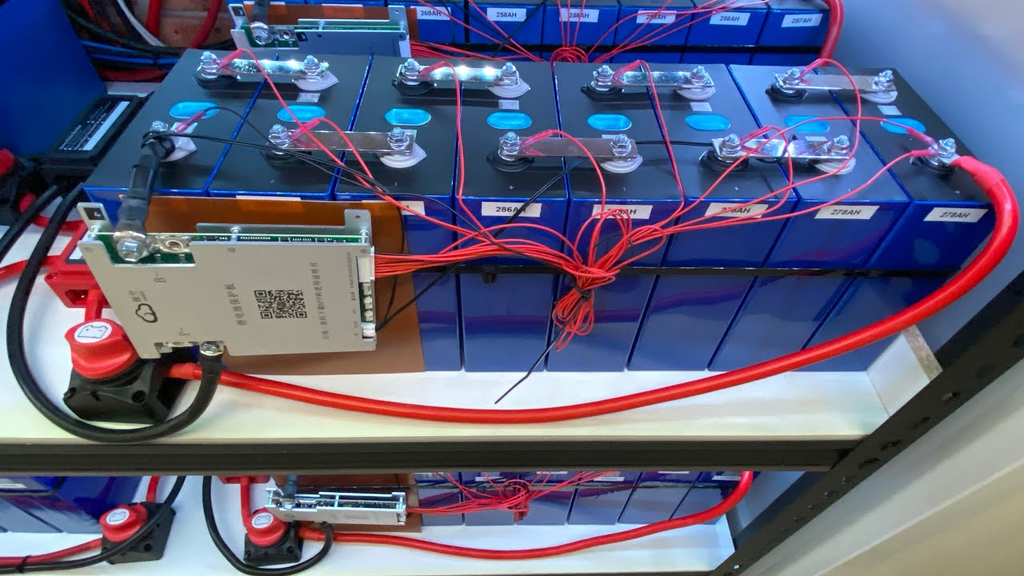
Translating C-rate into an actual current figure is what determines wire gauge, fuse rating, BMS sizing, and charger selection. The following figures apply the formula directly to pack sizes common in solar and portable power applications, including the battery capacity calculations used when sizing a portable power station.
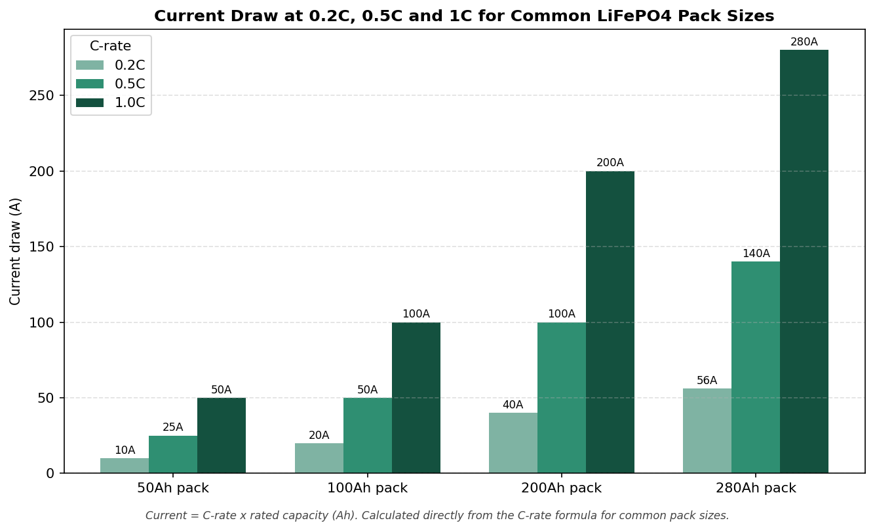
Figure 2. Current draw at 0.2C, 0.5C, and 1C for common LiFePO4 pack sizes, calculated as C-rate x rated capacity.
| Pack Size | 0.2C Current | 0.5C Current | 1C Current |
| 50Ah | 10A | 25A | 50A |
| 100Ah | 20A | 50A | 100A |
| 200Ah | 40A | 100A | 200A |
| 280Ah | 56A | 140A | 280A |
Charge C-Rate and Discharge C-Rate Are Not the Same Number
A battery’s rated charge C-rate and rated discharge C-rate are two separate specifications, and manufacturers commonly set them differently. Lithium plating, a process where metallic lithium deposits on the anode instead of intercalating properly, is primarily a charging problem and becomes more likely at high charge currents, especially in cold conditions. Discharge does not carry the same plating risk, which is why many LiFePO4 datasheets allow a higher continuous discharge rate than charge rate.
A typical pattern looks like this: recommended charge at 0.2C, maximum charge at 0.5C, recommended discharge at 0.5C, maximum continuous discharge at 1C. Applying a single C-rate figure to both directions, or assuming the higher discharge number also applies to charging, is one of the more common specification-reading mistakes.
Why C-Rate Isn’t Just a Speed Number: The Physics Behind Rate-Dependent Capacity
A battery does not deliver the same usable capacity at every C-rate. Two physical mechanisms explain why higher current pulls less total energy out of the same cell.
Internal Resistance and Voltage Sag
Every cell has internal resistance. Under load, that resistance causes a voltage drop proportional to current (V = IR), so a higher discharge current pulls the terminal voltage down faster. Because most systems stop discharging at a fixed cutoff voltage, a battery being pulled harder reaches that cutoff sooner in terms of energy delivered, even though the chemical capacity of the cell has not changed.
Diffusion Overpotential (Concentration Polarization)
Lithium ions have to physically diffuse through the electrode particles and the electrolyte to reach reaction sites. At high discharge rates, ion concentration near the particle surface can be depleted faster than diffusion can replenish it, creating a concentration gradient that further reduces usable capacity and increases heat generation, a mechanism described in detail by cell manufacturer research on rate-dependent lithium-ion capacity.
Heat Generation
Resistive losses scale with the square of current (P = I^2R), so doubling the discharge current roughly quadruples the resistive heating for the same internal resistance. This is why fast charging and fast discharging both raise a pack’s temperature, and why thermal management becomes a real design constraint above roughly 1C in packs without active cooling.
Why the Rated Capacity on the Label Assumes a Specific C-Rate
A battery’s headline capacity figure, such as “100Ah,” is measured at a specific test rate, and that rate is rarely the rate the battery is actually used at in the field. Most LiFePO4 datasheets state capacity at a slow 0.2C discharge, the rate least affected by internal resistance and diffusion losses. According to a LiFePO4 spec sheet analysis, a cell rated at a given capacity at 0.2C typically delivers about 90 to 95 percent of that figure when discharged at 1C, because the higher current sacrifices some of the theoretical capacity to internal resistance and voltage sag before the cutoff voltage is reached.
The practical consequence: a 100Ah battery discharged at 0.2C (20A) may genuinely deliver close to 100Ah, but the same battery discharged continuously at 1C (100A) might only deliver 90 to 95Ah before hitting its cutoff voltage. This is not a defect. It is an expected consequence of the C-rate the datasheet capacity was measured at. Anyone sizing a system around the printed Ah number should treat it as a best-case figure rather than a guarantee at every operating current, the same caution that applies when working through watt-hour capacity calculations for a specific load.
C-Rate and the Peukert Effect: Why Lithium Behaves Differently From Lead-Acid
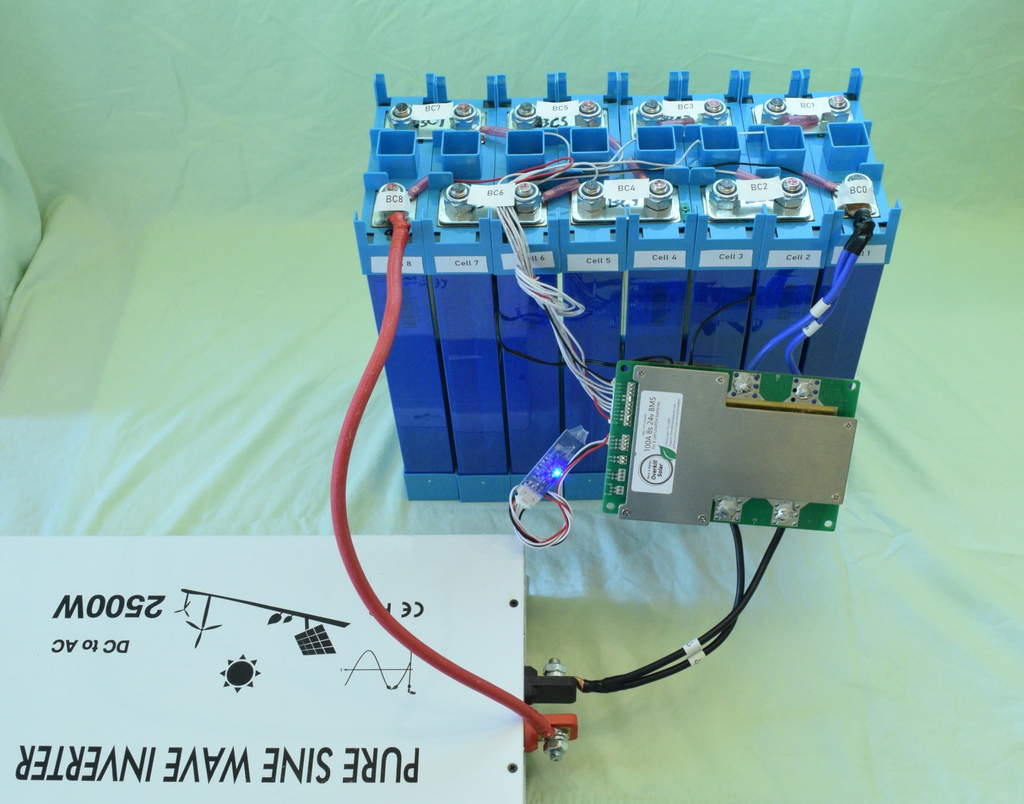
Peukert’s Law, developed in 1897 for lead-acid batteries, describes how available capacity drops as discharge current increases. The relationship is expressed as an exponent, n, applied to the discharge current. According to the original formulation of Peukert’s Law, lead-acid batteries typically have a Peukert exponent between 1.1 and 1.3, meaning a meaningful share of rated capacity disappears at higher discharge rates.
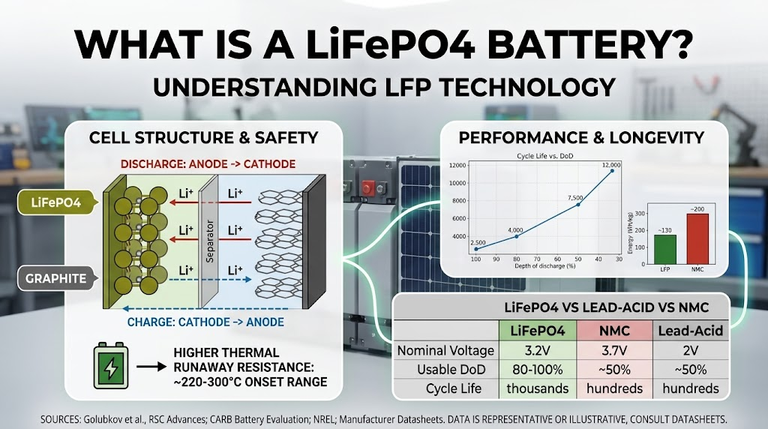
Lithium-ion and LiFePO4 chemistries are far less sensitive to this effect. Multiple sources documenting lithium cell testing report a Peukert exponent close to 1.0, typically in the 1.0 to 1.05 range, reflecting lithium’s much lower internal resistance and higher energy density compared with lead-acid. In practical terms, a LiFePO4 battery discharged at 1C will lose only a modest amount of its rated capacity compared with a 0.2C discharge, while a flooded lead-acid battery discharged at the same relative rate can lose 20 to 40 percent or more.
This is one of the core reasons LiFePO4 has displaced lead-acid in backup power and solar applications: the usable capacity stays much closer to the nameplate figure across the C-rates a real system actually uses, a distinction covered further in the site’s breakdown of Ah versus Wh.
C-Rate and Long-Term Battery Degradation
C-rate does not only affect how much energy is available right now. Sustained operation at high C-rates accelerates several long-term degradation mechanisms:
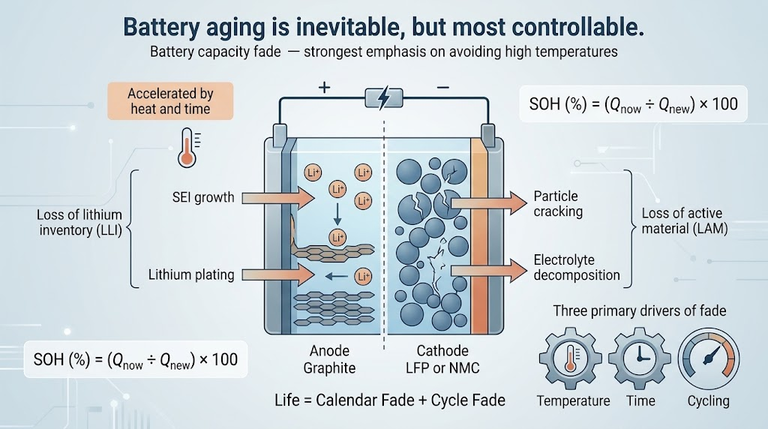
- Mechanical stress from volume change: Electrode particles expand and contract as lithium ions move in and out during each cycle. At higher C-rates this volume change happens faster and less uniformly across the particle, increasing microcracking over many cycles.
- Elevated operating temperature: Higher resistive heating at high C-rate accelerates the electrolyte decomposition and solid-electrolyte-interphase (SEI) growth reactions that drive long-term capacity fade, effects covered in more depth in this site’s guide to portable power station battery degradation.
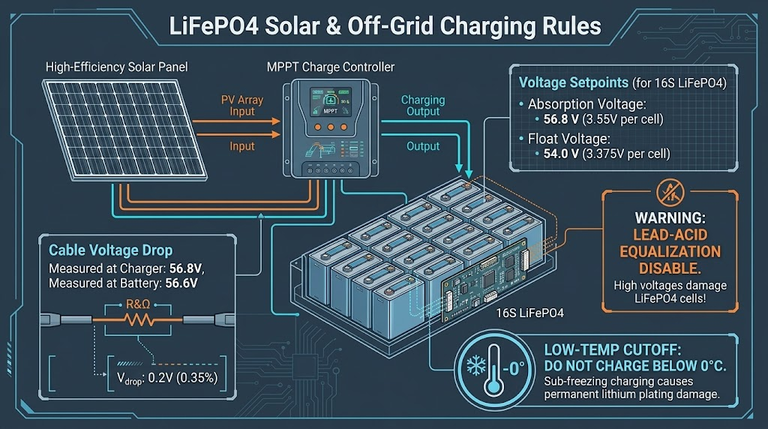
- Lithium plating risk on charge: Charging above roughly 1C, and especially charging at low temperature, increases the risk that lithium deposits as metal on the anode surface instead of intercalating normally. Plated lithium is both a permanent capacity loss and a safety concern, since it can eventually form dendrites.
None of this means high C-rate charging or discharging is inherently unsafe when it stays within the manufacturer’s rated limits and the BMS is configured correctly. It means that habitually operating at the upper edge of the rated range, rather than occasionally, trades some long-term cycle life for short-term speed. A pack cycled daily at 0.2C to 0.5C will generally outlast an identical pack cycled daily at 1C, even though both are technically within their rated limits.
Typical C-Rate Limits by Battery Chemistry
The safe C-rate range is set by cell chemistry and pack engineering, not by a universal standard. The figures below represent commonly cited ranges across manufacturer documentation and should always be confirmed against the specific cell or pack datasheet before system design.
| Chemistry | Typical Recommended Charge | Typical Max Continuous Discharge | Notes |
| LiFePO4 (prismatic, home backup) | 0.2C to 0.5C | 0.5C to 1C | Some prismatic cells rated to 3C discharge; verify per datasheet |
| NMC / NCA (cylindrical, 18650/21700) | 0.5C to 1C | 1C to 3C, up to 10C for high-power cells | Higher energy density, more temperature sensitive than LiFePO4 |
| LCO (consumer electronics) | 0.5C to 1C | 1C to 2C | Optimized for energy density, not high-rate use |
| Flooded lead-acid | 0.1C to 0.2C | 0.05C to 0.2C sustained | Strongly affected by the Peukert effect at higher rates |
| AGM / Gel lead-acid | 0.1C to 0.3C | 0.2C to 0.5C | Better rate tolerance than flooded, still well below lithium |
C-Rate and the BMS: Continuous Limits vs. Pulse Ratings
The C-rate a battery pack actually allows in the field is enforced by its battery management system (BMS), through a Charge Current Limit (CCL) and a Discharge Current Limit (DCL). These limits reflect a combination of the cell manufacturer’s rating, the BMS hardware’s own continuous current rating, and how well the pack enclosure dissipates heat, not the cell chemistry alone.
On communicating lithium packs, CCL and DCL are not fixed numbers printed once on a datasheet. A smart BMS recalculates them continuously, often every second, and transmits them to the inverter or charge controller alongside a third figure, the Charge Voltage Limit (CVL), which caps the voltage the charger is allowed to apply.
As a pack approaches full charge, gets hot, or develops cell imbalance, the BMS lowers CCL and CVL in real time to protect it, which is why the same battery can accept a full 0.5C charge current early in a charge cycle and taper to a fraction of that as it tops off. Eneronix’s guide to CVL, CCL, and DCL breaks down how these three values are calculated and transmitted, and what it means when an inverter display shows a CCL far below the battery’s rated maximum.
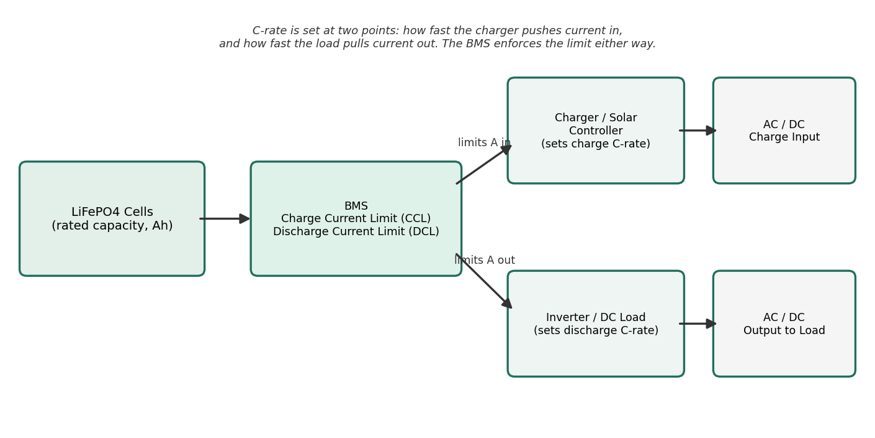
Figure 3. The BMS sits between the cells and the outside world, enforcing separate current limits on the charge path and the discharge path.
Two practical consequences follow from this. First, two batteries built from identical cells can carry different rated C-rates if their BMS hardware or pack wiring differ. A budget 100Ah pack might set its CCL at 30A even though the cells themselves could handle 50A, simply because the BMS or busbar wiring is not rated for more. Second, a printed C-rate on a consumer or hobby battery is sometimes a brief pulse rating rather than a continuous one.
A label reading “20C” or “40C” on a small lithium pack usually describes a discharge the pack can survive for a few seconds, not sustain for the full theoretical duration implied by the number. The continuous rating that actually matters for backup power and portable power station use is the one stated separately as “continuous discharge current” on the datasheet, not the largest number printed on the wrapper.
Cold-Weather Charging and C-Rate
Temperature changes what C-rate is actually safe, particularly for charging. Charging a lithium battery below 0 degrees Celsius sharply increases the risk of lithium plating, because ion diffusion into the anode slows down at low temperature while the applied current does not. Reputable LiFePO4 guidance, including a detailed cold-weather charging reference, recommends not charging below freezing unless the pack has a heater or explicitly supports low-temperature charging, and pre-warming the pack to roughly 5 degrees Celsius before charging at a reduced C-rate if charging in cold conditions is unavoidable. Discharge is generally more tolerant of cold than charge, though available power drops at low temperature and loads should be kept moderate.
C-Rate in Real Portable Power Stations: Translating Watts Into a C-Rate
Portable power stations are specified in watts and watt-hours, not amps and amp-hours, which hides the C-rate a household appliance is actually placing on the internal battery. Converting the two together reveals how close everyday use runs to the pack’s rated limits, and connects directly to how to calculate portable power station runtime.
Worked Example: 1000Wh Power Station Running a 1000W Load
Assume a 1000Wh unit built around a 12.8V nominal LiFePO4 pack and a household appliance drawing 1000W of continuous AC power through the built-in inverter, with a typical inverter efficiency of 90 percent.
- Pack capacity in Ah: 1000Wh / 12.8V = 78.1Ah
- DC power the battery must supply to cover the 1000W AC load and inverter losses: 1000W / 0.90 = 1111W
- Battery discharge current: 1111W / 12.8V = 86.8A
- C-rate: 86.8A / 78.1Ah = 1.11C
A full-power appliance load on a 1000Wh class power station commonly pushes the internal pack to roughly 1C or slightly above it, once inverter losses are accounted for, even though the datasheet never mentions the word “C-rate.” This is exactly why manufacturers rate these packs for at least 1C continuous discharge; anything less would not support their own advertised AC output. It also explains why running a power station at its rated maximum AC output for extended periods generates more heat and produces a shorter effective runtime than the simple Wh-divided-by-watts calculation from power station runtime calculations suggests, consistent with the capacity-at-rate discussion earlier in this article.
The same logic applies on the charging side. A power station’s solar input rating, say 500W into a 1000Wh unit, corresponds to roughly 500W / 12.8V = 39A, or about 0.5C, a rate well inside the range most LiFePO4 packs tolerate for regular charging.
Common Mistakes When Interpreting C-Rate
Treating a Pulse Rating as a Continuous Rating
A high C-rate printed on a consumer pack is often a short burst rating, not a sustained one. Always look for the word “continuous” on the datasheet before designing a system around a headline C-rate number.
Applying the Discharge C-Rate to Charging
Because plating risk is a charging problem, the safe charge C-rate is usually lower than the safe discharge C-rate. Using the higher discharge figure to size a charger risks exceeding the pack’s charge current limit.
Assuming Rated Capacity Holds at Any C-Rate
The Ah figure on the label was measured at a specific, usually low, C-rate. Expect somewhat less usable capacity at higher, real-world discharge currents, particularly above 1C.
Ignoring Temperature
A C-rate that is safe at 25 degrees Celsius may not be safe at 0 degrees Celsius, especially for charging. Cold-weather derating is a real specification, not an optional caution.
Confusing C-Rate With Runtime Directly
C-rate describes current relative to capacity, not the actual runtime of a specific appliance. Runtime also depends on inverter efficiency, depth of discharge limits, and load variability, covered in the site’s guide to battery capacity for portable power stations.
How C-Rate Relates to Capacity, Depth of Discharge, and Runtime
C-rate, capacity, depth of discharge, and runtime are four related but distinct specifications, and mixing them up is a common source of sizing errors:
- Capacity (Ah or Wh): how much energy the battery can store, a topic covered separately in watt-hour capacity calculation.
- C-rate: how fast current is being pushed into or pulled out of that stored capacity.
- Depth of discharge (DoD): how much of the stored capacity is actually used before recharging, which affects cycle life independently of C-rate.
- Runtime: the practical result of capacity, C-rate-adjusted usable energy, and load power combined, calculated in full in the site’s portable power station runtime guide.
A battery can have generous capacity and still be a poor fit for an application if its C-rate rating cannot support the required current. Sizing a system correctly means checking all four figures against the load, not just the headline Ah or Wh number.
Frequently Asked Questions
Is a higher C-rate battery always better?
No. A higher-rated C-rate battery tolerates faster charging and discharging, which matters for high-power tools or fast charging needs, but it does not increase stored energy and often trades some energy density or cycle life for that rate tolerance. For steady home backup and solar storage, a battery matched to the actual current the system draws is a better fit than one rated far beyond what it will ever see.
What C-rate should I use to charge a LiFePO4 battery every day?
Most LiFePO4 manufacturers recommend 0.2C for routine daily charging, reserving the higher 0.5C maximum for occasions when faster charging is genuinely needed. The exact figure should always come from the specific battery’s datasheet or BMS documentation.
Can I discharge a battery faster than its rated C-rate for a short burst?
Only if the manufacturer specifies a separate pulse or surge rating that covers it. Exceeding the continuous discharge current limit without such a rating risks tripping the BMS protection, overheating the pack, or in poorly protected batteries, permanent damage.
Does C-rate apply the same way to lead-acid and lithium batteries?
The formula is identical, but the consequences differ substantially. Lead-acid capacity drops sharply at higher C-rates because of the Peukert effect, while LiFePO4 and other lithium chemistries retain most of their rated capacity across the C-rates typical systems actually use.
Why does my power station get hot when running a high-wattage appliance?
A high AC load pushes the internal battery toward or above 1C once inverter losses are included, which increases internal resistive heating. This is normal within the unit’s rated limits, but sustained high-wattage use will run warmer and may reduce long-term battery life compared with lighter, intermittent use.
Conclusion
C-rate reduces a battery’s charge and discharge speed to one comparable number: current relative to capacity. The formula is simple, but its consequences reach into usable capacity, heat generation, cycle life, cold-weather safety, and how hard a portable power station’s appliance load actually works its internal pack.
For LiFePO4 systems used in home backup and solar storage, staying within the manufacturer’s rated charge C-rate, typically 0.2C to 0.5C, and rated continuous discharge C-rate, typically 0.5C to 1C, protects both the capacity printed on the label and the number of cycles the battery will deliver over its service life. Before designing around a battery’s C-rate, confirm the continuous rating on its actual datasheet or BMS configuration rather than the largest number printed on the case.
For sizing decisions that build on this, see the site’s guides to portable power station capacity, runtime calculation, and battery degradation over time.