Battery Depth of Discharge
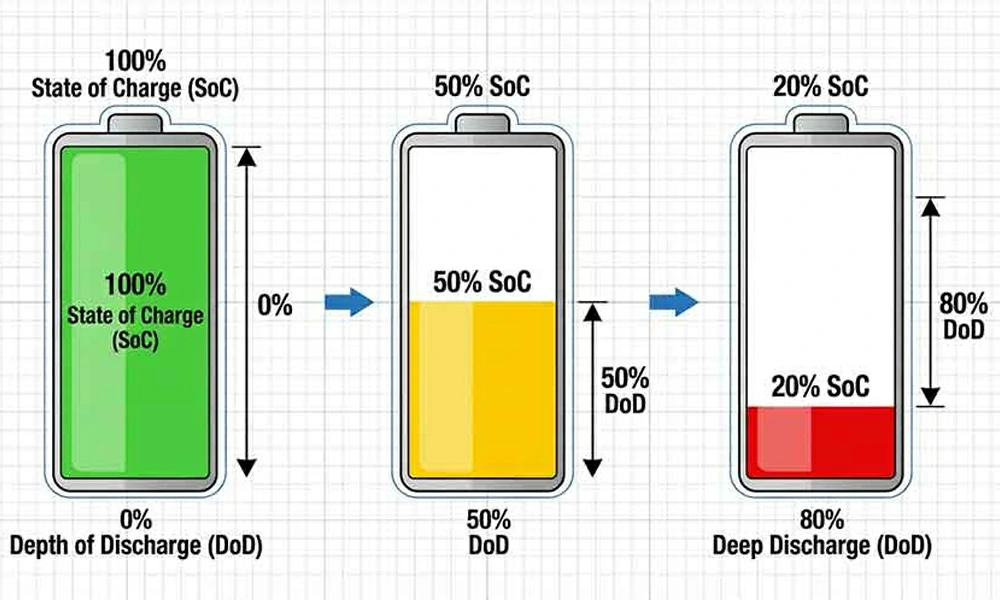
Quick answer: depth of discharge (DoD) is the percentage of a battery’s rated capacity that has been used in a discharge cycle. A 100Ah battery discharged to 40Ah remaining has reached 60% DoD. DoD is the mirror image of state of charge (SOC): DoD = 100% minus SOC. It matters because cycle life is not fixed. It depends directly on how deep each discharge goes. A LiFePO4 battery cycled to 50% DoD can deliver roughly twice the cycle count of the same battery cycled to 80% DoD, and a lead-acid battery repeatedly discharged past 50% can lose most of its rated life within a few hundred cycles.
What Depth of Discharge Actually Measures
Depth of discharge describes how much energy has been withdrawn from a battery relative to its rated capacity, expressed as a percentage. If a 200Ah lithium battery has delivered 120Ah since its last full charge, it sits at 60% DoD, with 80Ah remaining. The figure is expressed either in ampere-hours or as a percentage of rated capacity, with percentage the more common convention on datasheets and battery monitors.
DoD is distinct from cycle count and from state of health (SOH). A battery can reach 80% DoD on its first cycle and on its four-thousandth. What changes over the battery’s life is how much usable capacity remains at a full charge, which is what SOH tracks (see battery degradation in portable power stations for how that decline actually progresses). DoD describes a single discharge event. SOH describes the battery’s long-term condition.
Depth of Discharge vs. State of Charge
State of charge and depth of discharge describe the same physical quantity, read from opposite ends of the scale:
DoD (%) = 100% − SOC (%)
A battery sitting at 30% SOC has reached 70% DoD. A battery at 90% SOC has reached only 10% DoD. Most battery monitors and portable power station displays report SOC, while manufacturer cycle-life tables are almost always published against DoD, because DoD is the value that predicts stress on the cells. A spec sheet listing “5000 cycles at 50% DoD” has to be converted before it means anything next to a display reading “62% SOC.”
The related conversion, from a DoD limit to usable ampere-hours, is:
Usable Ah = Rated Ah × DoD (as a decimal)
A 100Ah battery cycled to a maximum 80% DoD delivers 80Ah of usable capacity on a normal cycle, with 20Ah held in reserve. That reserve is not wasted capacity. It is the margin that keeps the battery inside the range where cycle life holds up. Converting that Ah figure into a watt-hour energy budget, once voltage is factored in, is covered in how to calculate battery capacity in watt-hours and in Wh vs Ah: what is the difference.
Why Depth of Discharge Determines Cycle Life
Every discharge cycle stresses a battery’s internal chemistry, and the depth of that discharge sets how much stress each cycle applies. The relationship is not linear. Cutting DoD from 100% to 50% does not simply double cycle life; it typically multiplies it several times over, because the electrochemical strain near full discharge is disproportionately higher than the strain in the middle of the state-of-charge range.
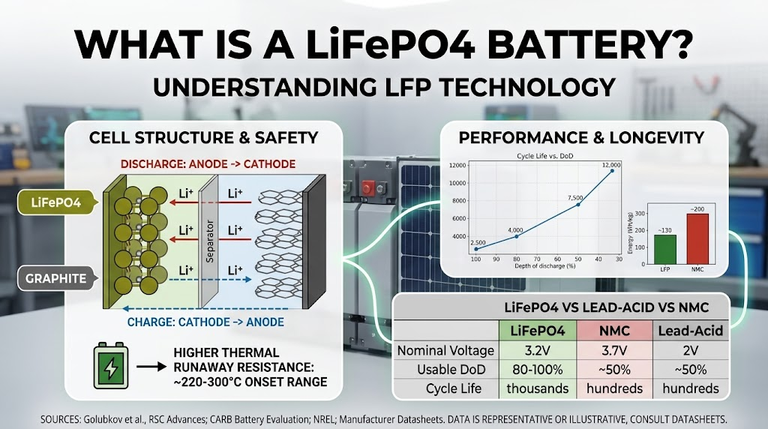
Victron Energy’s datasheet for its LFP-Smart lithium iron phosphate batteries states the relationship directly, with cycle life defined as cycles delivered before capacity falls below 80% of nominal, the industry-standard end-of-life threshold: 2,500 cycles at 80% DoD, 3,000 cycles at 70% DoD, and 5,000 cycles at 50% DoD. Moving from 80% DoD to 50% DoD doubles the cycle count on the same set of cells.
Research published in Applied Sciences on extending battery lifetime by avoiding high state of charge reaches a related conclusion from a different angle: time spent at high SOC, which is the same as shallow DoD at the top of the charge range, accelerates capacity fade. That finding is why many manufacturers now recommend partial-charge routines over habitual full charging for lithium batteries cycled daily rather than stored.
Lead-acid chemistry follows the same direction with a steeper penalty. Published data across flooded and AGM lead-acid batteries converges on roughly 50 to 100 cycles at 100% DoD, 300 to 500 cycles at 50% DoD, and 800 or more cycles at 30% DoD. The Northern Arizona Wind & Sun deep-cycle battery reference, a long-standing resource in the off-grid community, states plainly that a lead-acid battery cycled to 50% DoD daily will last roughly twice as long as the same battery cycled to 80% DoD, and that habitually discharging below 50% is the single most common cause of premature lead-acid failure in solar systems.
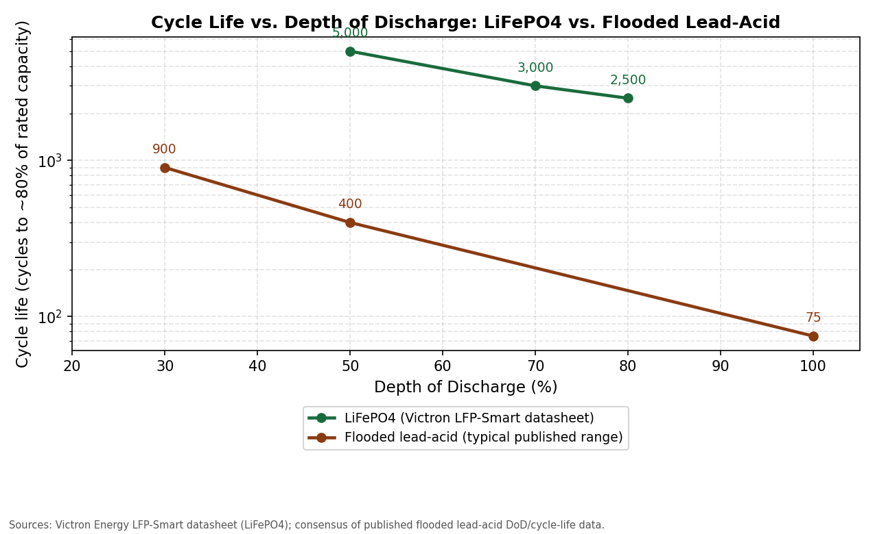
Figure 1. Cycle life falls sharply as depth of discharge increases, and the penalty is steeper for lead-acid than for LiFePO4. Sources: Victron Energy LFP-Smart datasheet; published flooded lead-acid DoD data (Northern Arizona Wind & Sun; consensus of manufacturer figures).
Recommended Depth of Discharge by Chemistry
These are typical manufacturer-published ranges. Always check the datasheet for the specific battery in use, since chemistry variants, cell suppliers, and BMS configurations shift the exact numbers.
| Chemistry | Recommended max DoD | Typical cycle life at that DoD | Practical note |
| LiFePO4 (LFP) | 80% (tolerates 100%) | 2,500–5,000 | 80% DoD is the practical sweet spot; full 100% DoD cycling is tolerated but shortens life versus shallower cycling. |
| NMC lithium-ion | 80–90% | 500–1,500 | More sensitive to deep discharge and heat than LiFePO4; less common in stationary off-grid banks. |
| Flooded lead-acid | 50% | 300–500 | Discharging below 50% SOC repeatedly is the leading cause of premature failure in solar banks. |
| AGM / gel (sealed lead-acid) | 50–60% | 300–500 | Marginally more tolerant than flooded, but still limited by the same lead-acid chemistry. |
Worked Example: Usable Capacity and Lifetime Energy Throughput
Two 100Ah, 12.8V batteries, one LiFePO4 and one flooded lead-acid, illustrate why the DoD limit matters more than the Ah rating printed on the case. This uses the battery capacity for a portable power station methodology, extended across the battery’s full service life rather than a single cycle.
LiFePO4 at 80% DoD vs. 50% DoD
- At 80% DoD: usable energy per cycle = 100Ah × 0.80 × 12.8V = 1,024 Wh. Rated cycle life at 80% DoD (Victron data) = 2,500 cycles. Lifetime throughput ≈ 2,560,000 Wh, or 2,560 kWh.
- At 50% DoD: usable energy per cycle = 100Ah × 0.50 × 12.8V = 640 Wh. Rated cycle life at 50% DoD = 5,000 cycles. Lifetime throughput ≈ 3,200,000 Wh, or 3,200 kWh.
The shallower cycle delivers less energy per discharge but more total energy over the battery’s service life. This is the practical reason many off-grid designers deliberately oversize a LiFePO4 bank rather than run it to its full rated DoD: a larger bank cycled shallowly can outlast a smaller bank cycled hard, while also lasting longer in calendar years.
Flooded Lead-Acid at 50% DoD vs. 100% DoD
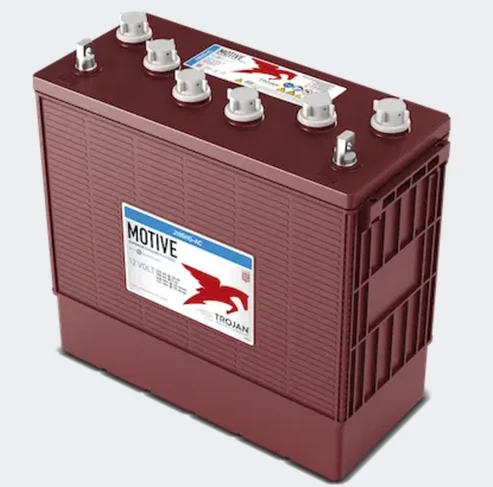
- At 50% DoD: usable energy per cycle = 100Ah × 0.50 × 12V = 600 Wh. Typical cycle life at 50% DoD ≈ 400 cycles (midpoint of the 300–500 published range). Lifetime throughput ≈ 240,000 Wh, or 240 kWh.
- At 100% DoD: usable energy per cycle = 100Ah × 1.00 × 12V = 1,200 Wh. Typical cycle life at 100% DoD ≈ 75 cycles (midpoint of the 50–100 published range). Lifetime throughput ≈ 90,000 Wh, or 90 kWh.
For lead-acid the gap is dramatic: keeping discharge at 50% DoD delivers roughly 2.7 times more total energy over the battery’s life than running it to 100% DoD, even though each individual cycle is smaller. This is the arithmetic behind the standard off-grid advice to size a lead-acid bank at double the daily energy requirement. The portable power station runtime calculation methodology applies the same usable-capacity logic to a single discharge event rather than lifetime throughput.
How a BMS or Low-Voltage Disconnect Enforces Depth of Discharge
A DoD limit is only useful if something actually stops the discharge at that point. Victron’s LFP-Smart 12.8V datasheet sets an end-of-discharge voltage of 11.2V, the point at which the battery’s internal BMS disconnects the load to protect the cells, regardless of what DoD percentage that happens to correspond to under the present load.
Cell voltage sags under load. Higher discharge current pulls terminal voltage down faster than the coulomb-counted state of charge alone would suggest, so the DoD a BMS actually delivers before cutoff is not a fixed number. It depends on discharge current. This is one reason a battery can disconnect earlier than expected under a heavy surge load, such as a compressor or motor start; see continuous power vs. surge power for how that surge demand is sized separately from continuous load.
Lead-acid systems without an internal BMS rely on the charge controller or inverter’s low-voltage disconnect (LVD) setting to enforce a DoD limit. That makes correct LVD configuration part of protecting the battery investment, not just an inverter setting to leave at the factory default.
Depth of Discharge in Off-Grid and Nigerian Solar Systems
A National Renewable Energy Laboratory study conducted with USAID modeled battery degradation for off-grid solar systems across several African sites, including Accra, Lodwar, Lusaka, Nakuru, and Niamey, explicitly building state of charge and depth of discharge into the degradation model alongside ambient temperature. Two findings from that modeling carry directly into Nigerian off-grid sizing decisions: lithium-ion batteries retained more of their rated life than lead-acid across the climates tested, and higher ambient temperatures, common across most of Nigeria for most of the year, compound the effect of deep discharge cycling rather than acting as a separate, independent factor.
The practical consequence: a backup system sized to cycle a lead-acid bank to 80% DoD during extended outages, a common compromise where budget forces an undersized battery bank, will see cycle life fall well below the manufacturer’s 50% DoD figures, and further still in a hot, poorly ventilated equipment room. Sizing the bank around a conservative DoD target, rather than around the rated Ah figure alone, is covered in what size portable power station do I need and solar panel sizing for a portable power station, where daily DoD budget is one of the inputs that sets both battery size and the solar array needed to recharge it before the next cycle.
Common Mistakes When Applying Depth of Discharge
- Sizing a lead-acid system on 100% of rated Ah. Rated capacity is not usable capacity for lead-acid. Sizing on the full nameplate figure guarantees the bank will be run into the cycle-life range that fails in a few hundred cycles rather than a few thousand.
- Treating LiFePO4 like lead-acid out of habit. Deliberately limiting a LiFePO4 bank to 50% DoD, the old lead-acid rule, wastes half the paid-for capacity for a cycle-life benefit that the chemistry does not need at that level.
- Confusing DoD direction with SOC. A display reading 70% SOC represents 30% DoD, not 70% DoD. Mixing the two up when comparing to a manufacturer’s cycle-life table produces the wrong conclusion about remaining safe capacity.
- Ignoring that cutoff voltage, not a percentage, is what actually stops discharge. Because voltage sags under load, the DoD delivered before a BMS or LVD trips is current-dependent, not a fixed percentage across every load profile.
- Ignoring temperature. The same DoD limit that preserves cycle life at moderate temperature accelerates degradation faster in consistently hot conditions, which is directly relevant across most Nigerian climates.
Frequently Asked Questions
Is 100% depth of discharge safe for a LiFePO4 battery?
It will not damage the battery in the way it would damage lead-acid, and most LiFePO4 BMS units allow it. It does shorten cycle life compared with a shallower DoD on the same cells, so 100% DoD is acceptable for occasional deep cycles but not recommended as the default daily routine where the battery is expected to last as long as possible.
What DoD should I use for off-grid solar sizing in Nigeria?
A conservative starting point is 80% DoD for LiFePO4 and 50% DoD for lead-acid, then size the battery bank and solar array around the usable capacity that DoD produces, not around the rated Ah figure. Higher ambient temperature across most of the country is a reason to stay conservative rather than push toward the chemistry’s maximum tolerated DoD.
Does depth of discharge change how I calculate runtime?
Yes. Runtime and load calculations should use usable capacity (rated capacity × DoD), not rated capacity, as the starting energy figure. The full runtime methodology is in how to calculate portable power station runtime.
How is depth of discharge different from C-rate?
DoD measures how much of a battery’s capacity has been used. C-rate measures how fast that capacity is being drawn or charged, independent of how much total capacity is involved. Both affect a battery differently, and both are explained in battery C-rate explained.
Conclusion
Depth of discharge is the single variable that connects how a battery is used to how long it lasts. The rated Ah or Wh figure on a battery’s label describes what it can hold, not what should be withdrawn on a normal cycle. LiFePO4 tolerates far deeper discharge than lead-acid before cycle life collapses, but even LiFePO4 gains meaningful extra lifetime throughput by staying at 80% DoD instead of 100%. Sizing a battery bank, a portable power station, or a full off-grid system around a defined DoD target, rather than around rated capacity alone, is what turns a manufacturer’s cycle-life spec into a system that actually reaches its expected service life in the field.